
- Start >
- Rivers >
- Discharge >
- Iller - Lech - Bodensee >
- Wertach >
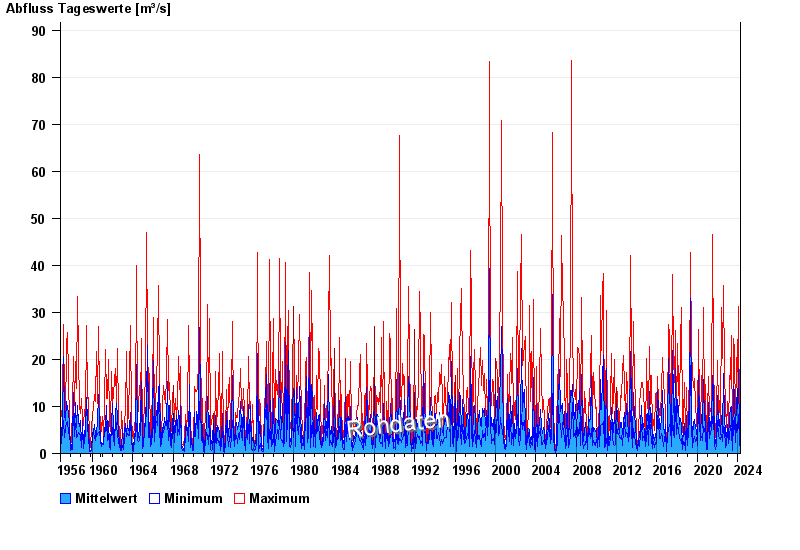
- Chart of total period

Chart of total period Wertach / Wertach
Discharge from 01.11.1956 to 19.04.2024
| Date | Mean value [m³/s] | Maximum [m³/s] | Minimum [m³/s] |
|---|---|---|---|
| 19.04.2024 | 0.881 | 1.01 | 0.854 |
| 18.04.2024 | 0.895 | 1.01 | 0.787 |
| 17.04.2024 | 0.895 | 1.09 | 0.722 |
| 16.04.2024 | 0.772 | 0.854 | 0.722 |
| 15.04.2024 | 0.766 | 0.854 | 0.668 |
| 14.04.2024 | 0.686 | 0.787 | 0.616 |
| 13.04.2024 | 0.647 | 0.787 | 0.57 |
© Bayerisches Landesamt für Umwelt 2024