
- Start >
- Rivers >
- Discharge >
- Iller - Lech - Bodensee >
- Waldstetten >
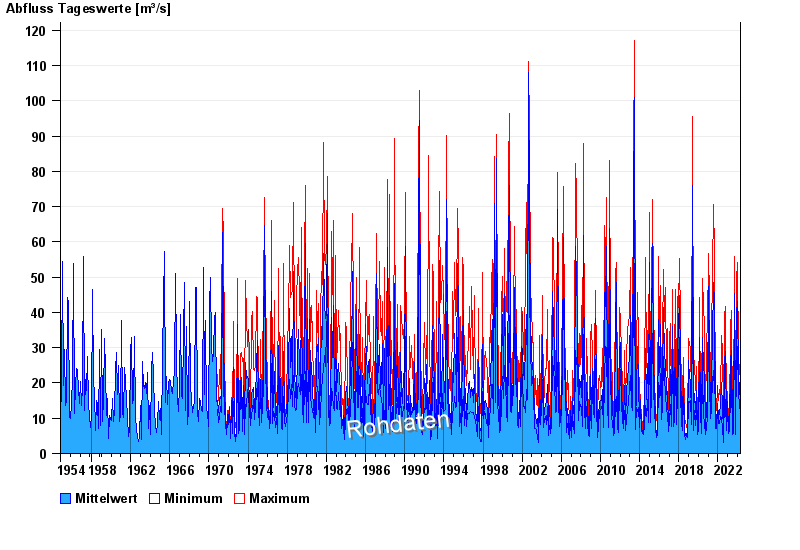
- Chart of total period

Chart of total period Waldstetten / Günz
Discharge from 01.11.1954 to 20.04.2024
| Date | Mean value [m³/s] | Maximum [m³/s] | Minimum [m³/s] |
|---|---|---|---|
| 20.04.2024 | 11.8 | 11.8 | 11.8 |
| 19.04.2024 | 11.7 | 12.6 | 10.2 |
| 18.04.2024 | 9.64 | 11.5 | 8.57 |
| 17.04.2024 | 7.71 | 9.54 | 5.51 |
| 16.04.2024 | 7.97 | 9.83 | 5.51 |
| 15.04.2024 | 6.87 | 9.2 | 5.76 |
| 14.04.2024 | 5.6 | 6.02 | 5.27 |
© Bayerisches Landesamt für Umwelt 2024