
- Start >
- Rivers >
- Discharge >
- Iller - Lech - Bodensee >
- Unterthingau >
- Chart of year

Chart of year Unterthingau / Kirnach
Discharge from 01.01.2024 to 16.04.2024
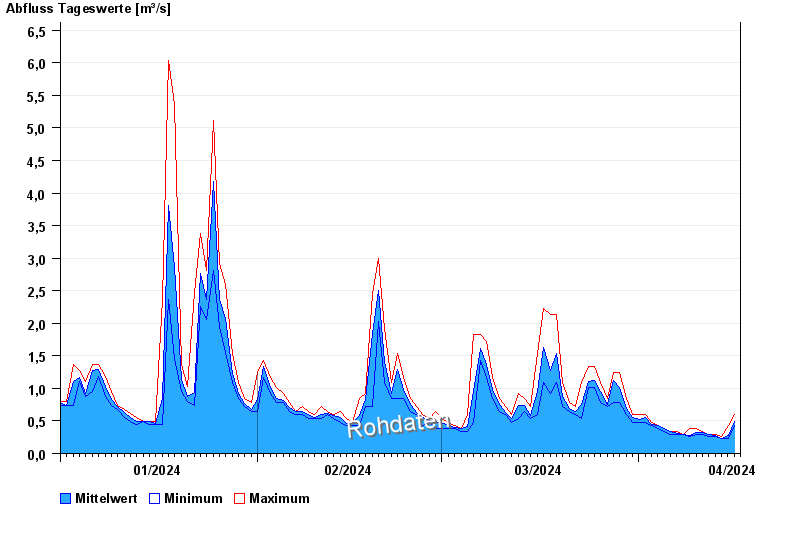
| Date | Mean value [m³/s] | Maximum [m³/s] | Minimum [m³/s] |
|---|---|---|---|
| 16.04.2024 | 0.479 | 0.593 | 0.432 |
| 15.04.2024 | 0.275 | 0.432 | 0.228 |
| 14.04.2024 | 0.234 | 0.262 | 0.228 |
| 13.04.2024 | 0.27 | 0.299 | 0.262 |
| 12.04.2024 | 0.297 | 0.299 | 0.262 |
| 11.04.2024 | 0.324 | 0.341 | 0.299 |
| 10.04.2024 | 0.321 | 0.385 | 0.299 |
© Bayerisches Landesamt für Umwelt 2024