
- Start >
- Rivers >
- Discharge >
- Iller - Lech - Bodensee >
- Unterthingau >
- Chart of year

Chart of year Unterthingau / Kirnach
Discharge from 01.01.2019 to 31.12.2019
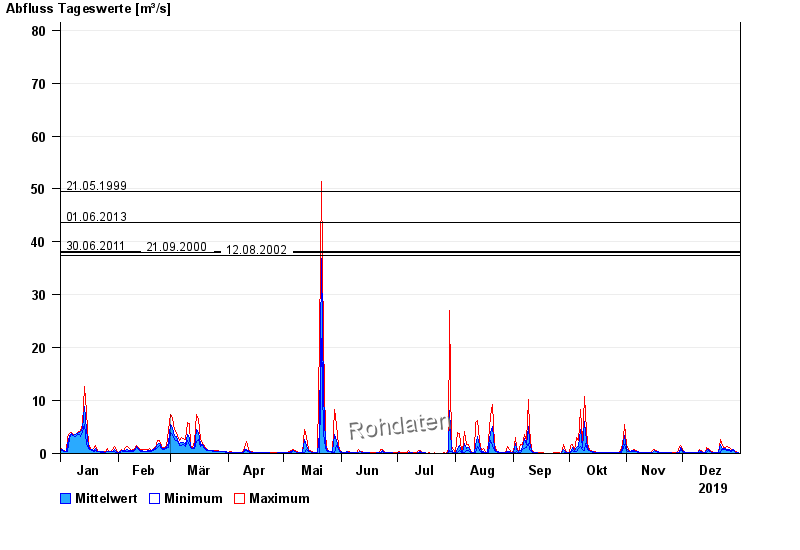
- 21.05.1999 Abfluss: 49,5 m³/s
- 01.06.2013 Abfluss: 43,7 m³/s
- 30.06.2011 Abfluss: 38,2 m³/s
- 21.09.2000 Abfluss: 38 m³/s
- 12.08.2002 Abfluss: 37,4 m³/s
| Date | Mean value [m³/s] | Maximum [m³/s] | Minimum [m³/s] |
|---|---|---|---|
| 31.12.2019 | 0.2 | 0.207 | 0.177 |
| 30.12.2019 | 0.251 | 0.316 | 0.207 |
| 29.12.2019 | 0.397 | 0.516 | 0.316 |
| 28.12.2019 | 0.692 | 0.771 | 0.516 |
| 27.12.2019 | 0.541 | 0.703 | 0.459 |
| 26.12.2019 | 0.76 | 1.15 | 0.516 |
| 25.12.2019 | 0.806 | 1.24 | 0.638 |
© Bayerisches Landesamt für Umwelt 2024