
- Start >
- Rivers >
- Discharge >
- Iller - Lech - Bodensee >
- Thalkirchdorf >
- Chart of total period

Chart of total period Thalkirchdorf / Konstanzer Ach
Discharge from 01.11.1955 to 25.04.2024
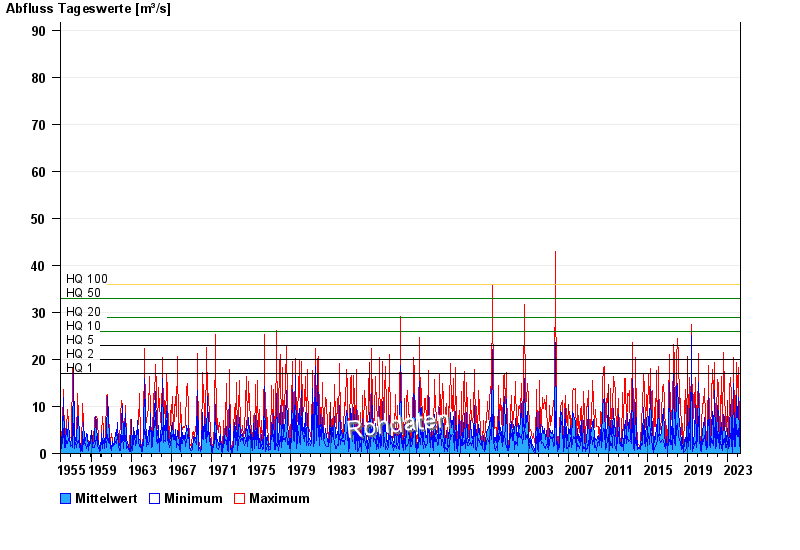
- HQ1 17 m³/s
- HQ2 20 m³/s
- HQ5 23 m³/s
- HQ10 26 m³/s
- HQ20 29 m³/s
- HQ50 33 m³/s
- HQ100 36 m³/s
| Date | Mean value [m³/s] | Maximum [m³/s] | Minimum [m³/s] |
|---|---|---|---|
| 25.04.2024 | 1.28 | 1.59 | 1.1 |
| 24.04.2024 | 1.14 | 1.3 | 1.01 |
| 23.04.2024 | 1.13 | 1.2 | 1.01 |
| 22.04.2024 | 1.36 | 1.59 | 1.2 |
| 21.04.2024 | 1.86 | 2.11 | 1.59 |
| 20.04.2024 | 2.47 | 3.18 | 2.11 |
| 19.04.2024 | 2.15 | 3.4 | 1.59 |
© Bayerisches Landesamt für Umwelt 2024