
- Start >
- Rivers >
- Discharge >
- Iller - Lech - Bodensee >
- Stielings >
- Chart of year

Chart of year Stielings / Leubas
Discharge from 01.01.2024 to 31.12.2024
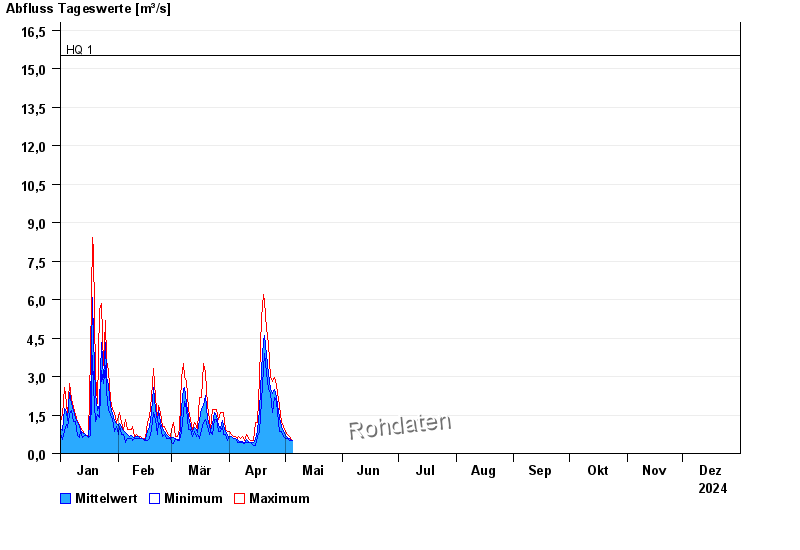
- HQ1 15,5 m³/s
- HQ2 17,5 m³/s
- HQ5 20 m³/s
- HQ10 22,5 m³/s
- HQ20 25 m³/s
- HQ50 28 m³/s
- HQ100 30 m³/s
| Date | Mean value [m³/s] | Maximum [m³/s] | Minimum [m³/s] |
|---|---|---|---|
| 25.04.2024 | 2.43 | 2.81 | 2.17 |
| 24.04.2024 | 2.32 | 2.81 | 1.58 |
| 23.04.2024 | 2.55 | 2.98 | 2.32 |
| 22.04.2024 | 3.1 | 4.28 | 2.48 |
| 21.04.2024 | 3.86 | 4.88 | 3.16 |
| 20.04.2024 | 4.61 | 5.94 | 3.9 |
| 19.04.2024 | 4.42 | 6.18 | 3.33 |
© Bayerisches Landesamt für Umwelt 2024