
- Start >
- Rivers >
- Discharge >
- Iller - Lech - Bodensee >
- Stielings >
- Chart of year

Chart of year Stielings / Leubas
Discharge from 01.01.2023 to 31.12.2023
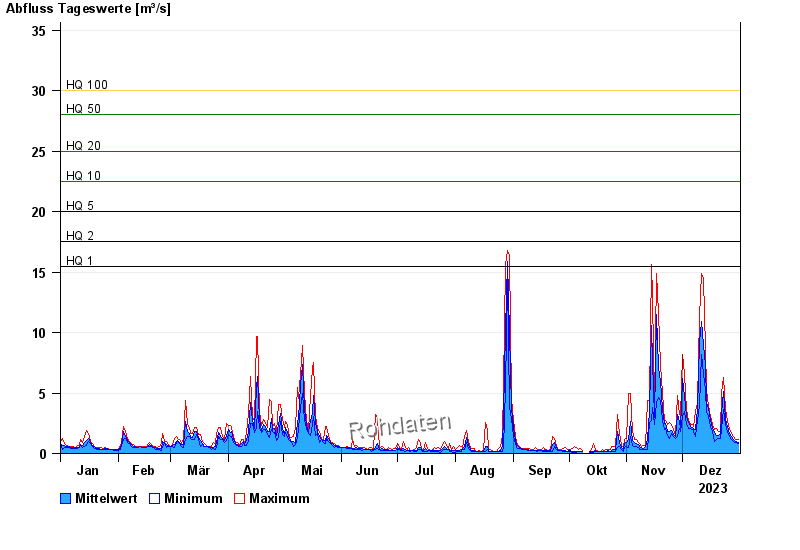
- HQ1 15,5 m³/s
- HQ2 17,5 m³/s
- HQ5 20 m³/s
- HQ10 22,5 m³/s
- HQ20 25 m³/s
- HQ50 28 m³/s
- HQ100 30 m³/s
| Date | Mean value [m³/s] | Maximum [m³/s] | Minimum [m³/s] |
|---|---|---|---|
| 31.12.2023 | 0.921 | 1.14 | 0.796 |
| 30.12.2023 | 0.979 | 1.14 | 0.904 |
| 29.12.2023 | 1.07 | 1.26 | 0.904 |
| 28.12.2023 | 1.19 | 1.39 | 1.02 |
| 27.12.2023 | 1.39 | 1.66 | 1.14 |
| 26.12.2023 | 1.63 | 1.95 | 1.39 |
| 25.12.2023 | 2.2 | 2.73 | 1.8 |
© Bayerisches Landesamt für Umwelt 2024