
- Start >
- Rivers >
- Discharge >
- Iller - Lech - Bodensee >
- Stielings >
- Chart of year

Chart of year Stielings / Leubas
Discharge from 01.01.2021 to 31.12.2021
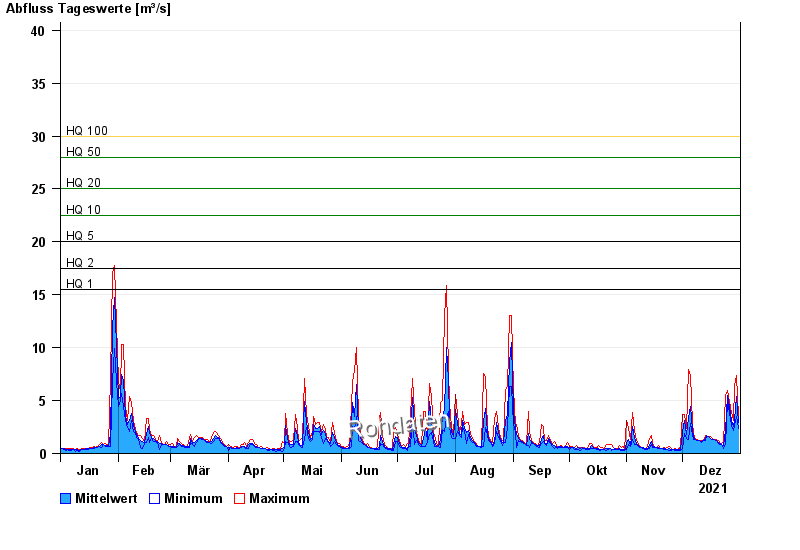
- HQ1 15,5 m³/s
- HQ2 17,5 m³/s
- HQ5 20 m³/s
- HQ10 22,5 m³/s
- HQ20 25 m³/s
- HQ50 28 m³/s
- HQ100 30 m³/s
| Date | Mean value [m³/s] | Maximum [m³/s] | Minimum [m³/s] |
|---|---|---|---|
| 31.12.2021 | 2.89 | 3.52 | 2.33 |
| 30.12.2021 | 5.37 | 7.4 | 3.52 |
| 29.12.2021 | 3.2 | 6.4 | 2.65 |
| 28.12.2021 | 2.53 | 3.16 | 2.18 |
| 27.12.2021 | 3.16 | 3.89 | 2.65 |
| 26.12.2021 | 4.45 | 4.88 | 3.89 |
| 25.12.2021 | 5.47 | 5.93 | 4.88 |
© Bayerisches Landesamt für Umwelt 2024