
- Start >
- Rivers >
- Discharge >
- Iller - Lech - Bodensee >
- Stielings >
- Chart of total period

Chart of total period Stielings / Leubas
Discharge from 01.06.1908 to 24.04.2024
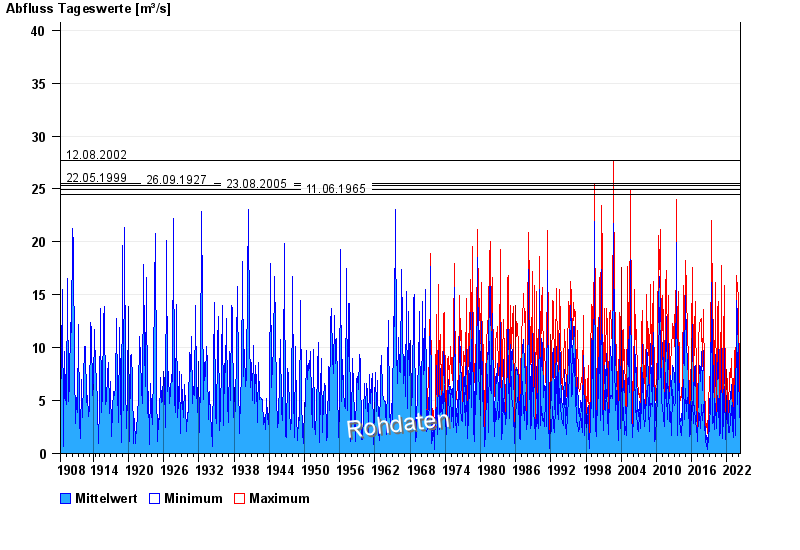
- 12.08.2002 Abfluss: 27,7 m³/s
- 22.05.1999 Abfluss: 25,5 m³/s
- 26.09.1927 Abfluss: 25,3 m³/s
- 23.08.2005 Abfluss: 24,9 m³/s
- 11.06.1965 Abfluss: 24,5 m³/s
| Date | Mean value [m³/s] | Maximum [m³/s] | Minimum [m³/s] |
|---|---|---|---|
| 24.04.2024 | 2.16 | 2.65 | 1.58 |
| 23.04.2024 | 2.55 | 2.98 | 2.32 |
| 22.04.2024 | 3.1 | 4.28 | 2.48 |
| 21.04.2024 | 3.86 | 4.88 | 3.16 |
| 20.04.2024 | 4.61 | 5.94 | 3.9 |
| 19.04.2024 | 4.42 | 6.18 | 3.33 |
| 18.04.2024 | 3.29 | 5.29 | 2.01 |
© Bayerisches Landesamt für Umwelt 2024