
- Start >
- Rivers >
- Discharge >
- Iller - Lech - Bodensee >
- Seltmans >
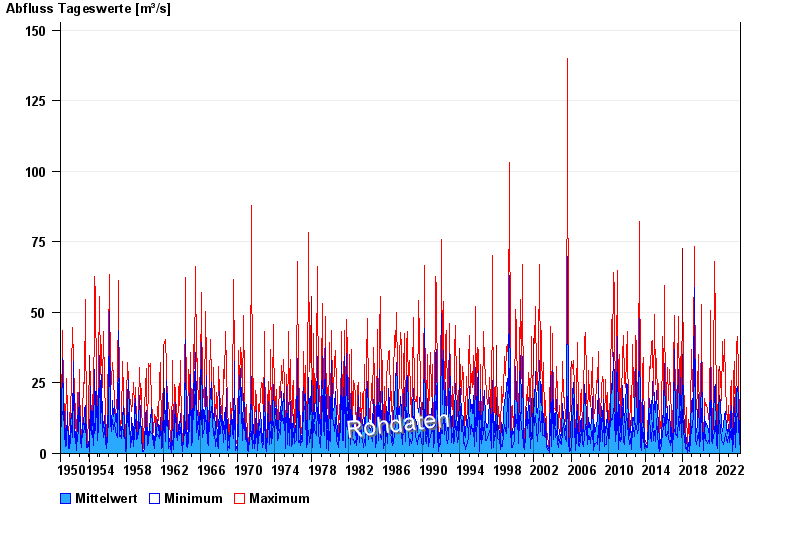
- Chart of total period

Chart of total period Seltmans / Untere Argen
Discharge from 01.11.1950 to 25.04.2024
| Date | Mean value [m³/s] | Maximum [m³/s] | Minimum [m³/s] |
|---|---|---|---|
| 25.04.2024 | 3.55 | 3.73 | 3.43 |
| 24.04.2024 | 2.99 | 3.89 | 2.35 |
| 23.04.2024 | 2.8 | 3.14 | 2.48 |
| 22.04.2024 | 3.37 | 3.89 | 2.87 |
| 21.04.2024 | 4.53 | 5.37 | 3.89 |
| 20.04.2024 | 5.7 | 6.46 | 5.2 |
| 19.04.2024 | 5.05 | 6.64 | 3.89 |
© Bayerisches Landesamt für Umwelt 2024