
- Start >
- Rivers >
- Discharge >
- Iller - Lech - Bodensee >
- Roth >
- Chart of total period

Chart of total period Roth / Roth
Discharge from 01.11.1978 to 19.04.2024
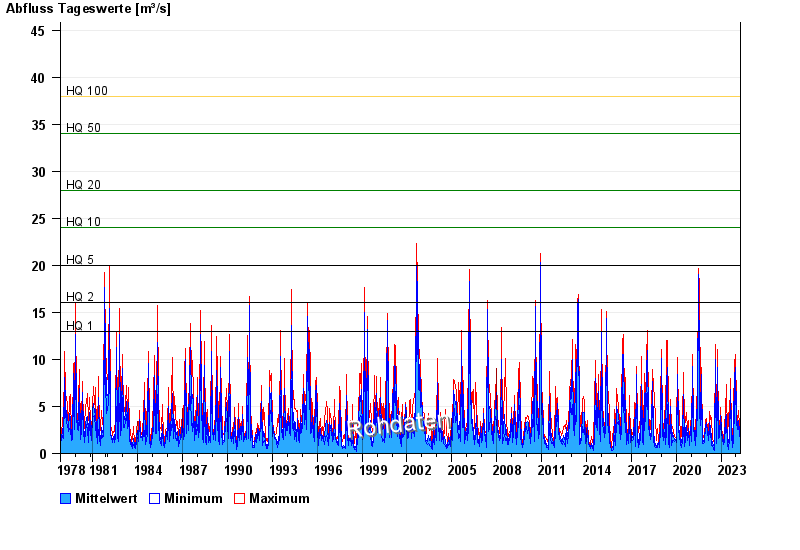
- HQ1 13 m³/s
- HQ2 16 m³/s
- HQ5 20 m³/s
- HQ10 24 m³/s
- HQ20 28 m³/s
- HQ50 34 m³/s
- HQ100 38 m³/s
| Date | Mean value [m³/s] | Maximum [m³/s] | Minimum [m³/s] |
|---|---|---|---|
| 19.04.2024 | 1.49 | 1.99 | 1.35 |
| 18.04.2024 | 1.33 | 1.45 | 1.26 |
| 17.04.2024 | 1.32 | 1.55 | 1.16 |
| 16.04.2024 | 1.14 | 1.16 | 1.07 |
| 15.04.2024 | 0.97 | 1.35 | 0.751 |
| 14.04.2024 | 0.828 | 0.828 | 0.828 |
| 13.04.2024 | 0.853 | 0.908 | 0.751 |
© Bayerisches Landesamt für Umwelt 2024