
- Start >
- Rivers >
- Discharge >
- Iller - Lech - Bodensee >
- Rosenheim o.d. Mangfallmündung >
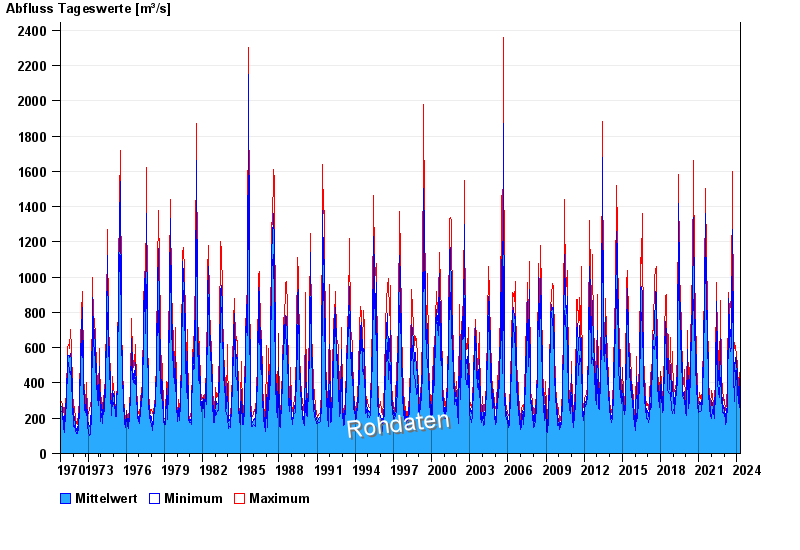
- Chart of total period

Chart of total period Rosenheim o.d. Mangfallmündung / Inn
Discharge from 01.11.1970 to 16.04.2024
| Date | Mean value [m³/s] | Maximum [m³/s] | Minimum [m³/s] |
|---|---|---|---|
| 16.04.2024 | 507 | 533 | 480 |
| 15.04.2024 | 480 | 533 | 372 |
| 14.04.2024 | 345 | 368 | 322 |
| 13.04.2024 | 336 | 365 | 312 |
| 12.04.2024 | 345 | 362 | 332 |
| 11.04.2024 | 336 | 368 | 318 |
| 10.04.2024 | 403 | 431 | 365 |
© Bayerisches Landesamt für Umwelt 2024