
- Start >
- Rivers >
- Discharge >
- Iller - Lech - Bodensee >
- Remshart >
- Chart of total period

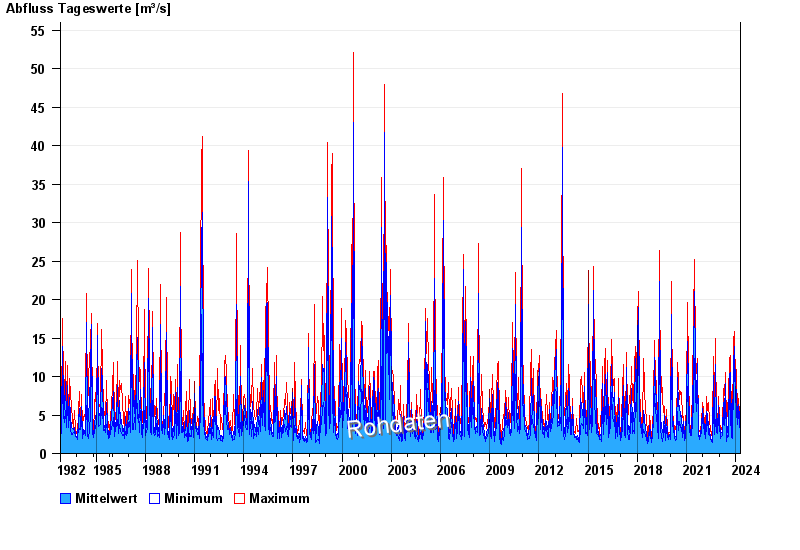
Chart of total period Remshart / Kammel
Discharge from 01.11.1982 to 18.04.2024
| Date | Mean value [m³/s] | Maximum [m³/s] | Minimum [m³/s] |
|---|---|---|---|
| 18.04.2024 | 3.5 | 3.67 | 3.34 |
| 17.04.2024 | 3.08 | 3.84 | 2.73 |
| 16.04.2024 | 2.98 | 3.18 | 2.87 |
| 15.04.2024 | 2.45 | 3.18 | 2.06 |
| 14.04.2024 | 2.23 | 2.3 | 2.06 |
| 13.04.2024 | 2.28 | 2.44 | 2.18 |
| 12.04.2024 | 2.31 | 2.44 | 2.18 |
© Bayerisches Landesamt für Umwelt 2024