
- Start >
- Rivers >
- Discharge >
- Iller - Lech - Bodensee >
- Pfronten Ried >
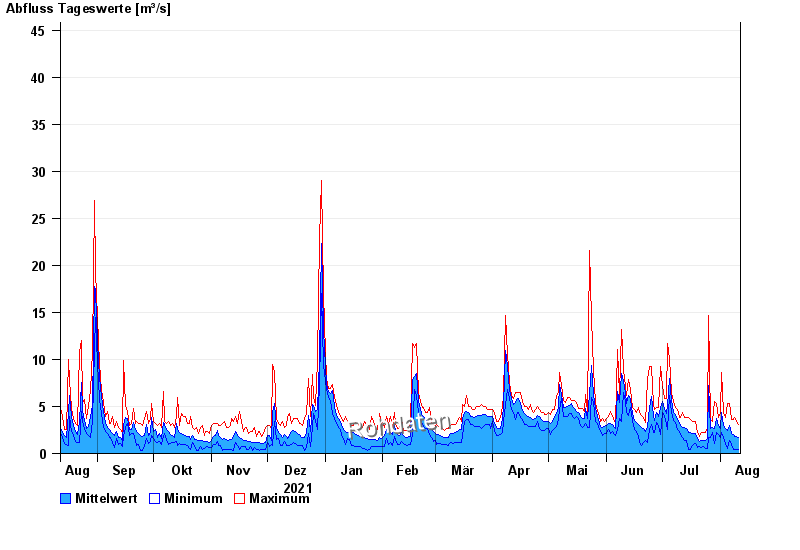
- Chart of year

Chart of year Pfronten Ried / Vils
Discharge from 12.08.2021 to 11.08.2022
- 22.05.1999 Abfluss: 160 m³/s
- 10.08.1970 Abfluss: 147 m³/s
- 22.08.2005 Abfluss: 127 m³/s
- 06.08.2000 Abfluss: 123 m³/s
- 12.08.2002 Abfluss: 116 m³/s
| Date | Mean value [m³/s] | Maximum [m³/s] | Minimum [m³/s] |
|---|---|---|---|
| 11.08.2022 | 1.67 | 3.11 | 0.381 |
| 10.08.2022 | 1.78 | 3.35 | 0.419 |
| 09.08.2022 | 1.85 | 3.86 | 0.419 |
| 08.08.2022 | 1.97 | 3.6 | 0.419 |
| 07.08.2022 | 2.17 | 3.6 | 0.93 |
| 06.08.2022 | 2.96 | 5.28 | 1.39 |
| 05.08.2022 | 2.42 | 5.28 | 0.511 |
© Bayerisches Landesamt für Umwelt 2024