
- Start >
- Rivers >
- Discharge >
- Iller - Lech - Bodensee >
- Pfronten Ried >
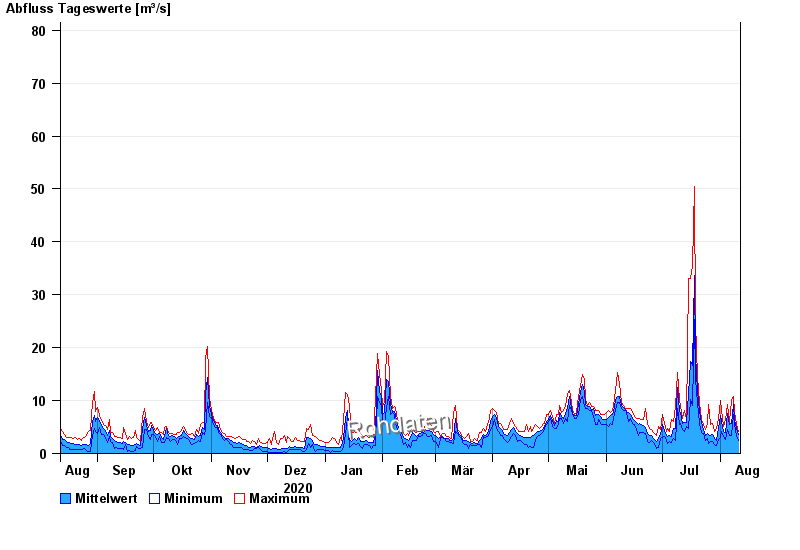
- Chart of year

Chart of year Pfronten Ried / Vils
Discharge from 12.08.2020 to 11.08.2021
- 22.05.1999 Abfluss: 160 m³/s
- 10.08.1970 Abfluss: 147 m³/s
- 22.08.2005 Abfluss: 127 m³/s
- 06.08.2000 Abfluss: 123 m³/s
- 12.08.2002 Abfluss: 116 m³/s
| Date | Mean value [m³/s] | Maximum [m³/s] | Minimum [m³/s] |
|---|---|---|---|
| 11.08.2021 | 3.59 | 4.23 | 2.52 |
| 10.08.2021 | 4.77 | 5.4 | 3.44 |
| 09.08.2021 | 6.25 | 7.74 | 5.4 |
| 08.08.2021 | 9.17 | 10.8 | 7.38 |
| 07.08.2021 | 5.58 | 9.99 | 3.44 |
| 06.08.2021 | 5.45 | 6.03 | 3.44 |
| 05.08.2021 | 7.55 | 9.24 | 4.51 |
© Bayerisches Landesamt für Umwelt 2024