
- Start >
- Rivers >
- Discharge >
- Iller - Lech - Bodensee >
- Pfronten Ried >
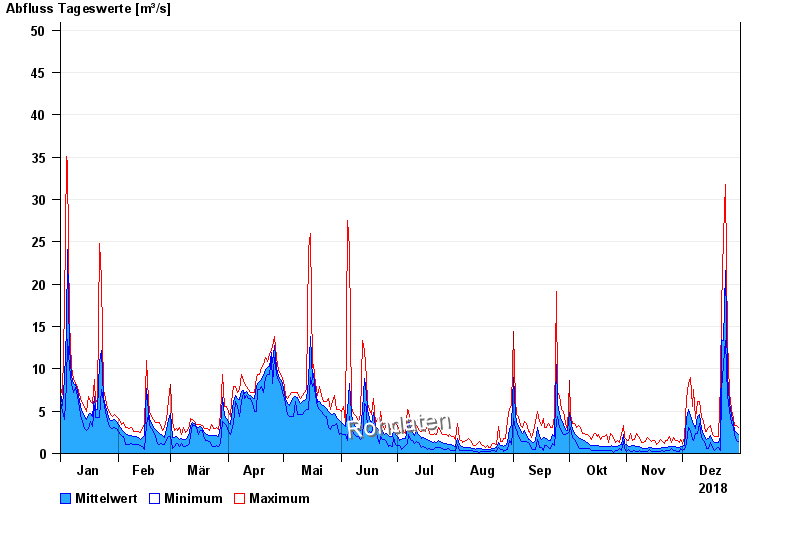
- Chart of year

Chart of year Pfronten Ried / Vils
Discharge from 01.01.2018 to 31.12.2018
- 22.05.1999 Abfluss: 160 m³/s
- 10.08.1970 Abfluss: 147 m³/s
- 22.08.2005 Abfluss: 127 m³/s
- 06.08.2000 Abfluss: 123 m³/s
- 12.08.2002 Abfluss: 116 m³/s
| Date | Mean value [m³/s] | Maximum [m³/s] | Minimum [m³/s] |
|---|---|---|---|
| 31.12.2018 | 2.27 | 3.08 | 1.39 |
| 30.12.2018 | 2.46 | 3.32 | 1.53 |
| 29.12.2018 | 2.77 | 3.32 | 2.22 |
| 28.12.2018 | 3.6 | 4.09 | 3.08 |
| 27.12.2018 | 4.62 | 5.23 | 3.57 |
| 26.12.2018 | 5.93 | 7.17 | 4.93 |
| 25.12.2018 | 9.39 | 13.4 | 6.83 |
© Bayerisches Landesamt für Umwelt 2024