
- Start >
- Rivers >
- Discharge >
- Iller - Lech - Bodensee >
- Pfronten Ried >
- Chart of year

Chart of year Pfronten Ried / Vils
Discharge from 30.07.2021 to 29.07.2022
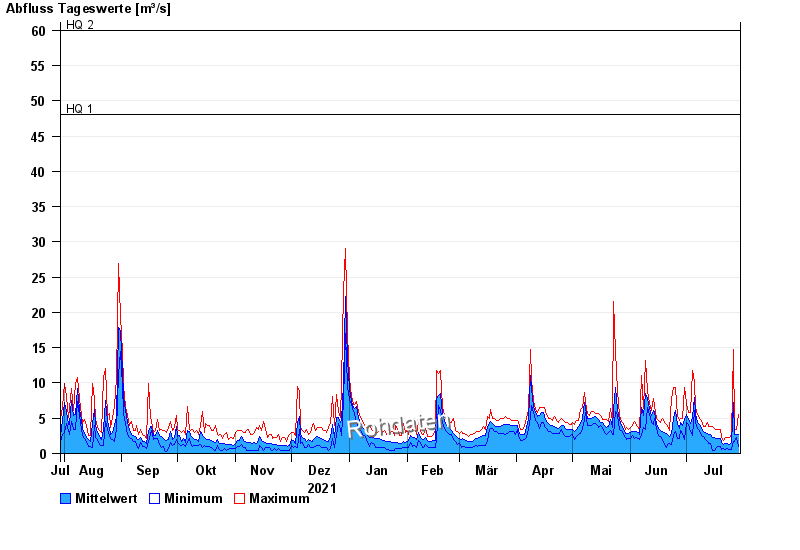
- HQ1 48 m³/s
- HQ2 60 m³/s
- HQ5 70 m³/s
- HQ10 85 m³/s
- HQ20 100 m³/s
- HQ50 120 m³/s
- HQ100 140 m³/s
| Date | Mean value [m³/s] | Maximum [m³/s] | Minimum [m³/s] |
|---|---|---|---|
| 29.07.2022 | 2.66 | 5.58 | 1.03 |
| 28.07.2022 | 2.76 | 3.35 | 2.24 |
| 27.07.2022 | 2.67 | 3.6 | 1.69 |
| 26.07.2022 | 7.19 | 14.7 | 1.69 |
| 25.07.2022 | 1.55 | 2.65 | 0.564 |
| 24.07.2022 | 1.34 | 2.24 | 0.564 |
| 23.07.2022 | 1.35 | 2.24 | 0.691 |
© Bayerisches Landesamt für Umwelt 2024