
- Start >
- Rivers >
- Discharge >
- Iller - Lech - Bodensee >
- Pfronten Ried >
- Chart of year

Chart of year Pfronten Ried / Vils
Discharge from 01.01.2023 to 31.12.2023
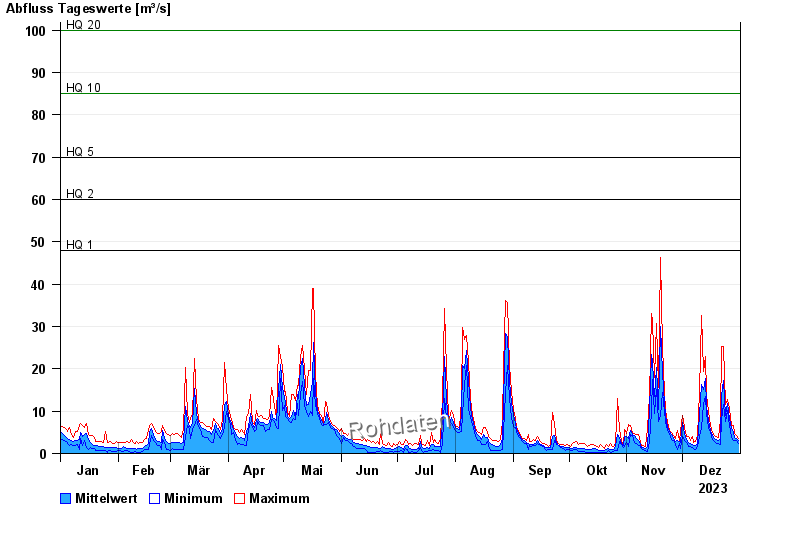
- HQ1 48 m³/s
- HQ2 60 m³/s
- HQ5 70 m³/s
- HQ10 85 m³/s
- HQ20 100 m³/s
- HQ50 120 m³/s
- HQ100 140 m³/s
| Date | Mean value [m³/s] | Maximum [m³/s] | Minimum [m³/s] |
|---|---|---|---|
| 31.12.2023 | 3.02 | 3.5 | 2.33 |
| 30.12.2023 | 3.47 | 4.32 | 3.01 |
| 29.12.2023 | 3.76 | 4.61 | 3.01 |
| 28.12.2023 | 4.91 | 6.52 | 3.01 |
| 27.12.2023 | 5.8 | 6.52 | 3.77 |
| 26.12.2023 | 8.18 | 10.6 | 6.52 |
| 25.12.2023 | 11.7 | 12.7 | 10.2 |
© Bayerisches Landesamt für Umwelt 2024