
- Start >
- Rivers >
- Discharge >
- Iller - Lech - Bodensee >
- Oberstaufen >
- Chart of total period

Chart of total period Oberstaufen / Weißach
Discharge from 01.11.1930 to 19.04.2024
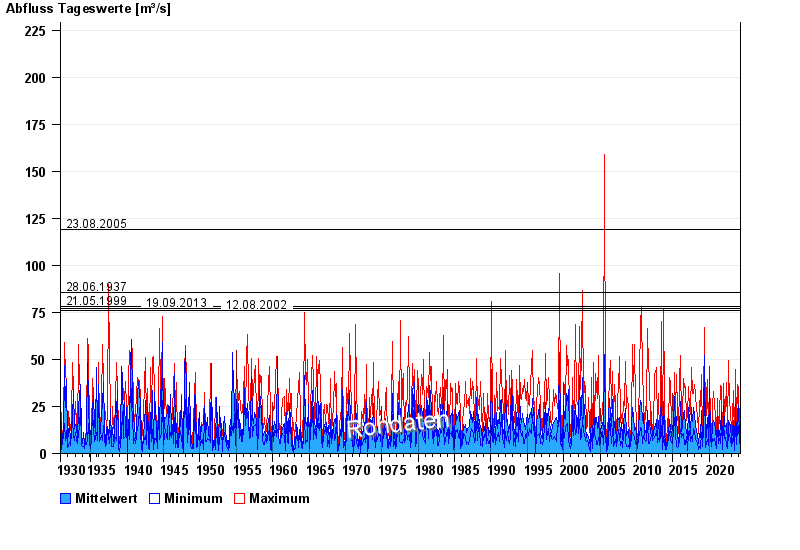
- 23.08.2005 Abfluss: 119 m³/s
- 28.06.1937 Abfluss: 85,6 m³/s
- 21.05.1999 Abfluss: 77,9 m³/s
- 19.09.2013 Abfluss: 77,3 m³/s
- 12.08.2002 Abfluss: 75,8 m³/s
| Date | Mean value [m³/s] | Maximum [m³/s] | Minimum [m³/s] |
|---|---|---|---|
| 19.04.2024 | 2.84 | 2.84 | 2.84 |
| 18.04.2024 | 2.72 | 3.17 | 2.39 |
| 17.04.2024 | 3.13 | 4.51 | 2.39 |
| 16.04.2024 | 2.18 | 2.68 | 1.88 |
| 15.04.2024 | 2.38 | 2.84 | 2 |
| 14.04.2024 | 2.07 | 2.53 | 1.76 |
| 13.04.2024 | 1.89 | 2.39 | 1.65 |
© Bayerisches Landesamt für Umwelt 2024