
- Start >
- Rivers >
- Discharge >
- Iller - Lech - Bodensee >
- Nattenhausen >
- Chart of year

Chart of year Nattenhausen / Günz
Discharge from 01.01.2024 to 25.04.2024
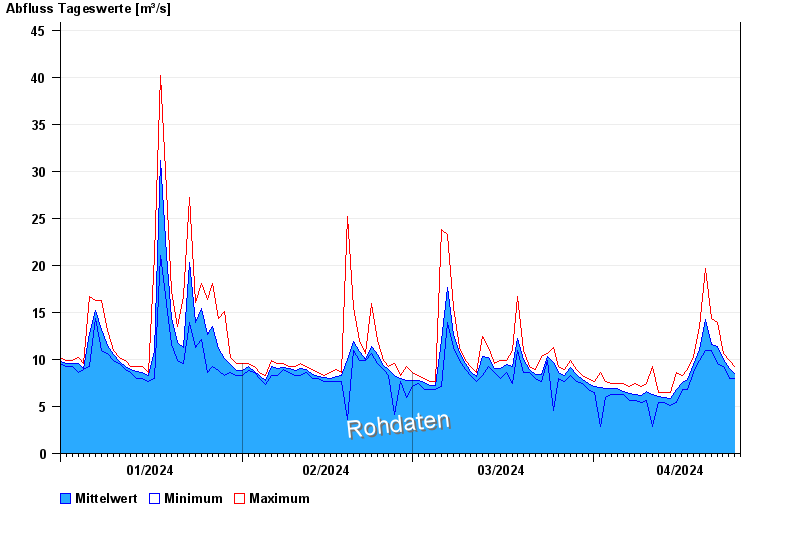
| Date | Mean value [m³/s] | Maximum [m³/s] | Minimum [m³/s] |
|---|---|---|---|
| 25.04.2024 | 8.61 | 9.26 | 8 |
| 24.04.2024 | 9.08 | 9.92 | 8 |
| 23.04.2024 | 9.97 | 10.6 | 9.26 |
| 22.04.2024 | 11.4 | 13.9 | 9.62 |
| 21.04.2024 | 11.6 | 14.3 | 11 |
| 20.04.2024 | 14.2 | 19.7 | 11 |
| 19.04.2024 | 11.1 | 13.5 | 9.92 |
© Bayerisches Landesamt für Umwelt 2024