
- Start >
- Rivers >
- Discharge >
- Iller - Lech - Bodensee >
- Lechbruck >
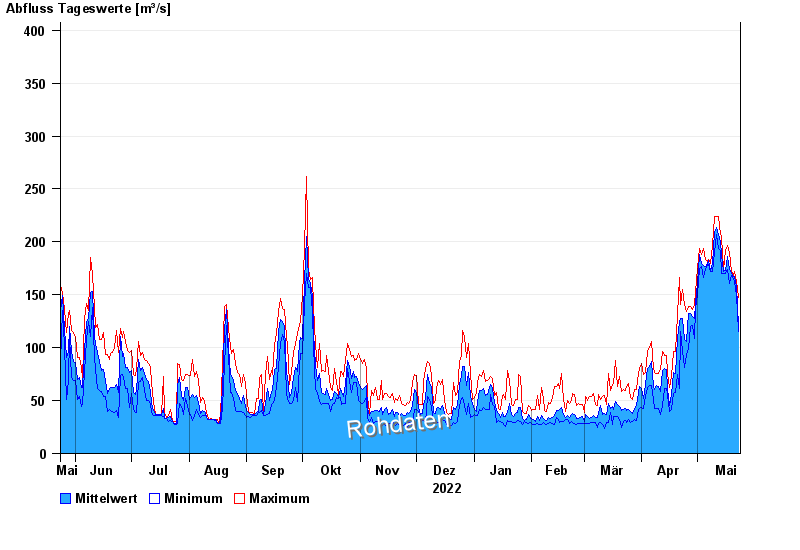
- Chart of year

Chart of year Lechbruck / Lech
Discharge from 24.05.2022 to 23.05.2023
note
Messwerte beeinflusst durch Kraftwerkssteuerungen.
- 10.08.1970 Abfluss: 971 m³/s
- 22.05.1999 Abfluss: 855 m³/s
- 23.08.2005 Abfluss: 836 m³/s
- 13.05.1999 Abfluss: 700 m³/s
- 23.07.1966 Abfluss: 640 m³/s
| Date | Mean value [m³/s] | Maximum [m³/s] | Minimum [m³/s] |
|---|---|---|---|
| 23.05.2023 | 120 | 147 | 115 |
| 22.05.2023 | 158 | 163 | 149 |
| 21.05.2023 | 167 | 172 | 163 |
| 20.05.2023 | 167 | 168 | 165 |
| 19.05.2023 | 170 | 172 | 168 |
| 18.05.2023 | 174 | 190 | 161 |
| 17.05.2023 | 186 | 197 | 174 |
© Bayerisches Landesamt für Umwelt 2024