
- Start >
- Rivers >
- Discharge >
- Iller - Lech - Bodensee >
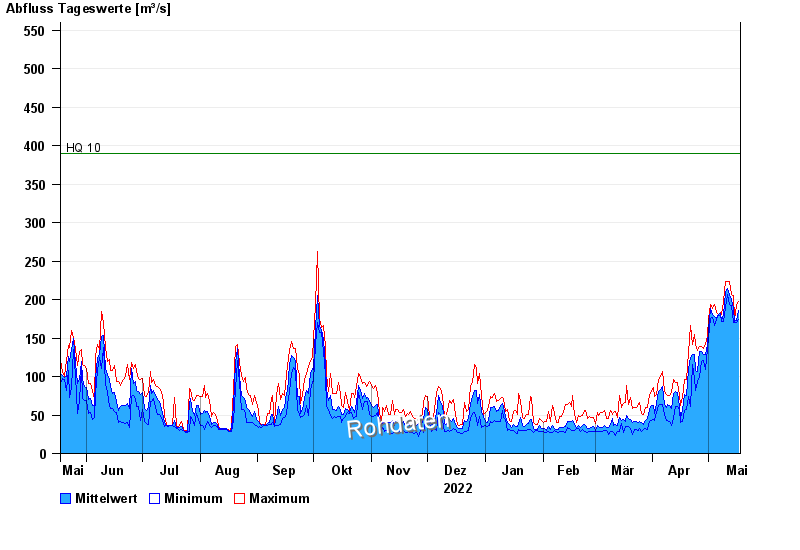
- Lechbruck >
- Chart of year

Chart of year Lechbruck / Lech
Discharge from 18.05.2022 to 17.05.2023
note
Messwerte beeinflusst durch Kraftwerkssteuerungen.
- HQ10 390 m³/s
- HQ100 800 m³/s
| Date | Mean value [m³/s] | Maximum [m³/s] | Minimum [m³/s] |
|---|---|---|---|
| 17.05.2023 | 186 | 197 | 174 |
| 16.05.2023 | 173 | 192 | 170 |
| 15.05.2023 | 172 | 174 | 170 |
| 14.05.2023 | 188 | 205 | 170 |
| 13.05.2023 | 200 | 207 | 192 |
| 12.05.2023 | 207 | 224 | 194 |
| 11.05.2023 | 214 | 224 | 207 |
© Bayerisches Landesamt für Umwelt 2024