
- Start >
- Rivers >
- Discharge >
- Iller - Lech - Bodensee >
- Lechbruck >
- Chart of year

Chart of year Lechbruck / Lech
Discharge from 01.01.2024 to 19.04.2024
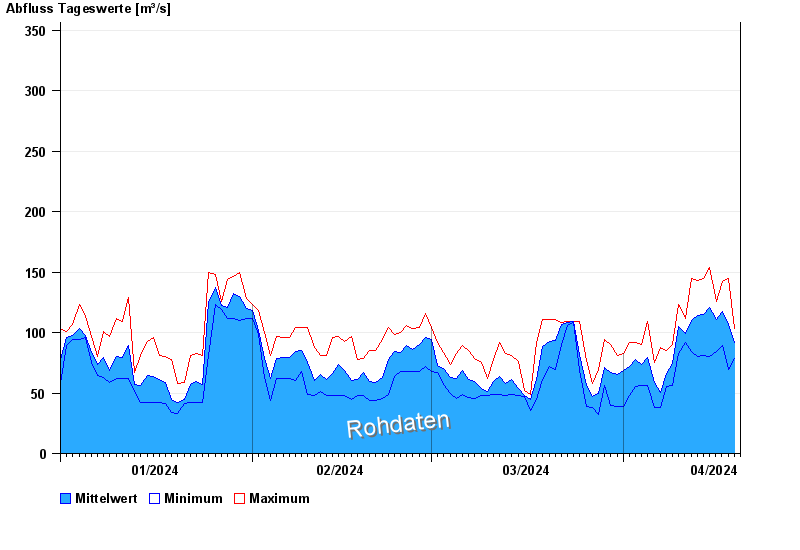
note
Messwerte beeinflusst durch Kraftwerkssteuerungen.
- HQ10 390 m³/s
- HQ100 800 m³/s
| Date | Mean value [m³/s] | Maximum [m³/s] | Minimum [m³/s] |
|---|---|---|---|
| 19.04.2024 | 88.8 | 100 | 87.8 |
| 18.04.2024 | 107 | 145 | 69.5 |
| 17.04.2024 | 117 | 142 | 89 |
| 16.04.2024 | 111 | 126 | 84 |
| 15.04.2024 | 121 | 154 | 80.2 |
| 14.04.2024 | 115 | 145 | 81.4 |
| 13.04.2024 | 114 | 143 | 80.2 |
© Bayerisches Landesamt für Umwelt 2024