
- Start >
- Rivers >
- Discharge >
- Iller - Lech - Bodensee >
- Lechbruck >
- Chart of total period

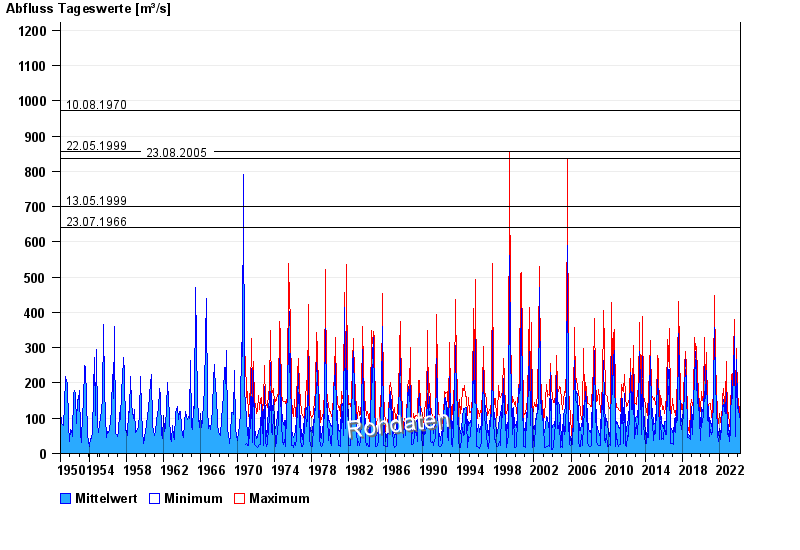
Chart of total period Lechbruck / Lech
Discharge from 01.11.1950 to 25.04.2024
note
Messwerte beeinflusst durch Kraftwerkssteuerungen.
- 10.08.1970 Abfluss: 971 m³/s
- 22.05.1999 Abfluss: 855 m³/s
- 23.08.2005 Abfluss: 836 m³/s
- 13.05.1999 Abfluss: 700 m³/s
- 23.07.1966 Abfluss: 640 m³/s
| Date | Mean value [m³/s] | Maximum [m³/s] | Minimum [m³/s] |
|---|---|---|---|
| 25.04.2024 | 42.5 | 65.1 | 35.1 |
| 24.04.2024 | 44.6 | 55.9 | 37.1 |
| 23.04.2024 | 49.2 | 72.9 | 38.5 |
| 22.04.2024 | 54.4 | 90.5 | 35.1 |
| 21.04.2024 | 42.9 | 61.9 | 37.8 |
| 20.04.2024 | 52.6 | 76.5 | 38.5 |
| 19.04.2024 | 91.9 | 103 | 78.9 |
© Bayerisches Landesamt für Umwelt 2024