
- Start >
- Rivers >
- Discharge >
- Iller - Lech - Bodensee >
- Lechbruck >
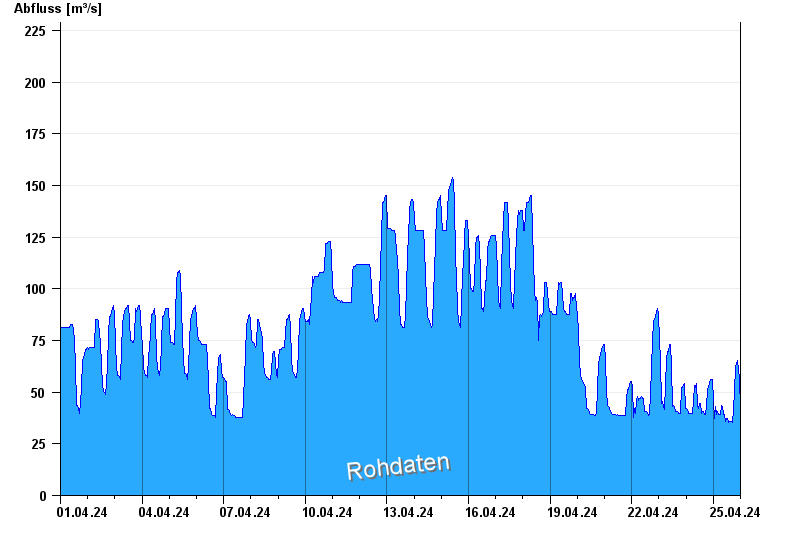
- Chart of month

Chart of month Lechbruck / Lech
Discharge from 01.04.2024 to 25.04.2024
note
Messwerte beeinflusst durch Kraftwerkssteuerungen.
- 10.08.1970 Abfluss: 971 m³/s
- 22.05.1999 Abfluss: 855 m³/s
- 23.08.2005 Abfluss: 836 m³/s
- 13.05.1999 Abfluss: 700 m³/s
- 23.07.1966 Abfluss: 640 m³/s
| Date | Runoff [m³/s] |
|---|---|
| 25.04.2024 09:15 | 39.2 |
| 25.04.2024 09:00 | 39.2 |
| 25.04.2024 08:45 | 39.2 |
| 25.04.2024 08:30 | 39.9 |
| 25.04.2024 08:15 | 40.7 |
| 25.04.2024 08:00 | 42.2 |
| 25.04.2024 07:45 | 42.9 |
© Bayerisches Landesamt für Umwelt 2024