
- Start >
- Rivers >
- Discharge >
- Iller - Lech - Bodensee >
- Lauben >
- Chart of total period

Chart of total period Lauben / Günz
Discharge from 01.11.1976 to 25.04.2024
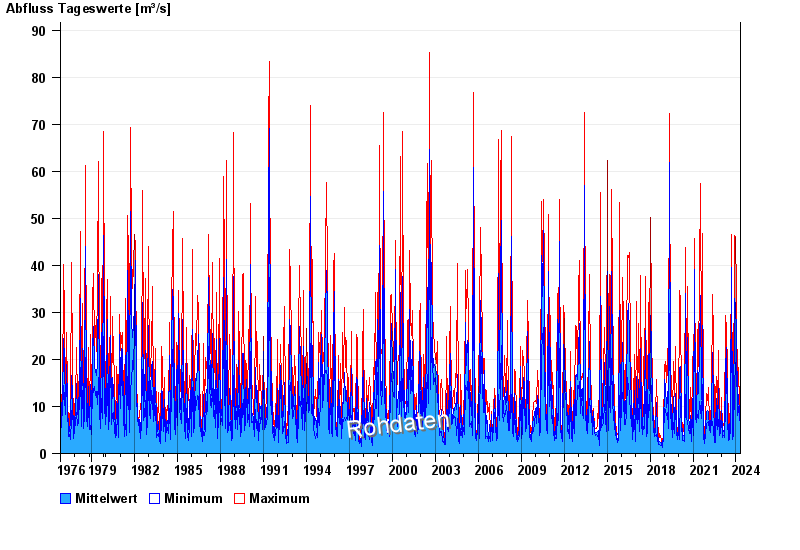
| Date | Mean value [m³/s] | Maximum [m³/s] | Minimum [m³/s] |
|---|---|---|---|
| 25.04.2024 | 5.43 | 5.61 | 5.12 |
| 24.04.2024 | 5.64 | 6.12 | 5.36 |
| 23.04.2024 | 6.3 | 6.94 | 5.87 |
| 22.04.2024 | 7.61 | 9.02 | 6.67 |
| 21.04.2024 | 8.14 | 9.36 | 7.51 |
| 20.04.2024 | 11.2 | 13.8 | 8.73 |
| 19.04.2024 | 8.49 | 10.4 | 7.51 |
© Bayerisches Landesamt für Umwelt 2024