
- Start >
- Rivers >
- Discharge >
- Iller - Lech - Bodensee >
- Landsberg >
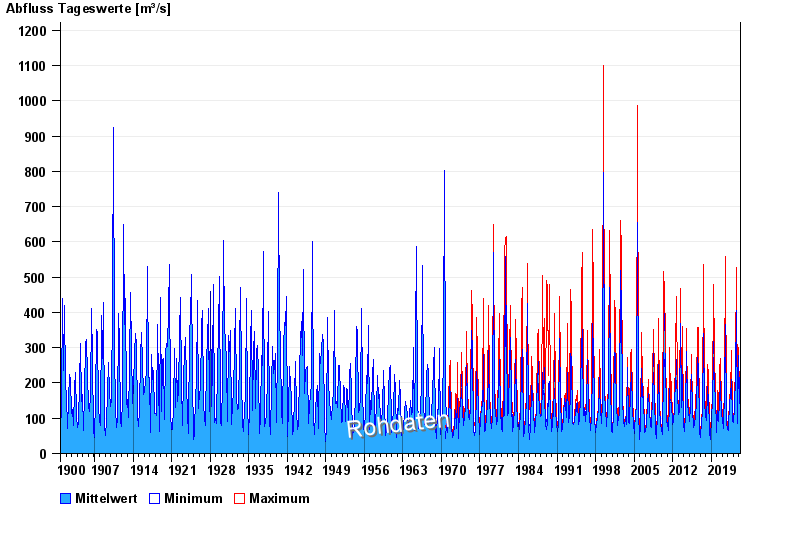
- Chart of total period

Chart of total period Landsberg / Lech
Discharge from 01.11.1900 to 23.04.2024
note
Messwerte beeinflusst durch Kraftwerkssteuerungen.
| Date | Mean value [m³/s] | Maximum [m³/s] | Minimum [m³/s] |
|---|---|---|---|
| 23.04.2024 | 64 | 66.9 | 57.8 |
| 22.04.2024 | 64.5 | 65 | 63.2 |
| 21.04.2024 | 64.6 | 65 | 63.2 |
| 20.04.2024 | 73.4 | 86.2 | 63.2 |
| 19.04.2024 | 101 | 107 | 84.4 |
| 18.04.2024 | 121 | 128 | 105 |
| 17.04.2024 | 128 | 128 | 126 |
© Bayerisches Landesamt für Umwelt 2024