
- Start >
- Rivers >
- Discharge >
- Iller - Lech - Bodensee >
- Landsberg >
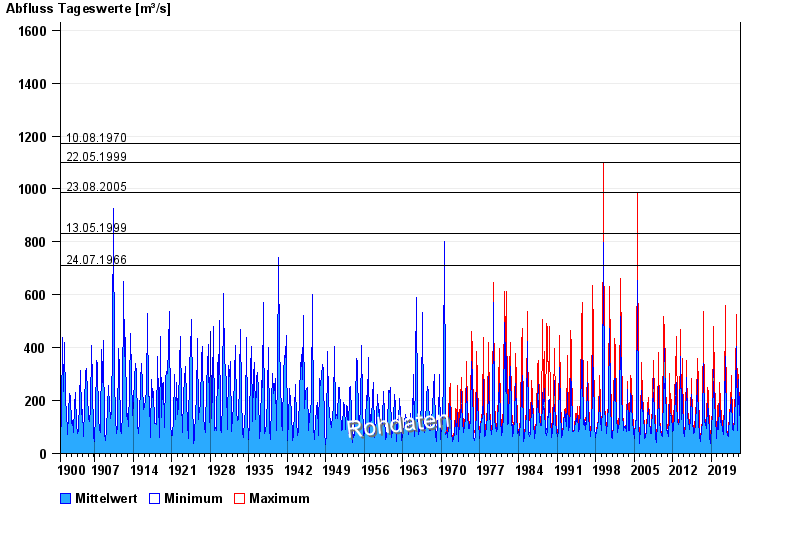
- Chart of total period

Chart of total period Landsberg / Lech
Discharge from 01.11.1900 to 25.04.2024
note
Messwerte beeinflusst durch Kraftwerkssteuerungen.
- 10.08.1970 Abfluss: 1170 m³/s
- 22.05.1999 Abfluss: 1100 m³/s
- 23.08.2005 Abfluss: 987 m³/s
- 13.05.1999 Abfluss: 830 m³/s
- 24.07.1966 Abfluss: 712 m³/s
| Date | Mean value [m³/s] | Maximum [m³/s] | Minimum [m³/s] |
|---|---|---|---|
| 25.04.2024 | 58.5 | 59.6 | 57.8 |
| 24.04.2024 | 58.3 | 59.6 | 56.1 |
| 23.04.2024 | 60.7 | 66.9 | 57.8 |
| 22.04.2024 | 64.5 | 65 | 63.2 |
| 21.04.2024 | 64.6 | 65 | 63.2 |
| 20.04.2024 | 73.4 | 86.2 | 63.2 |
| 19.04.2024 | 101 | 107 | 84.4 |
© Bayerisches Landesamt für Umwelt 2024