
- Start >
- Rivers >
- Discharge >
- Iller - Lech - Bodensee >
- Landsberg >
- Chart of month

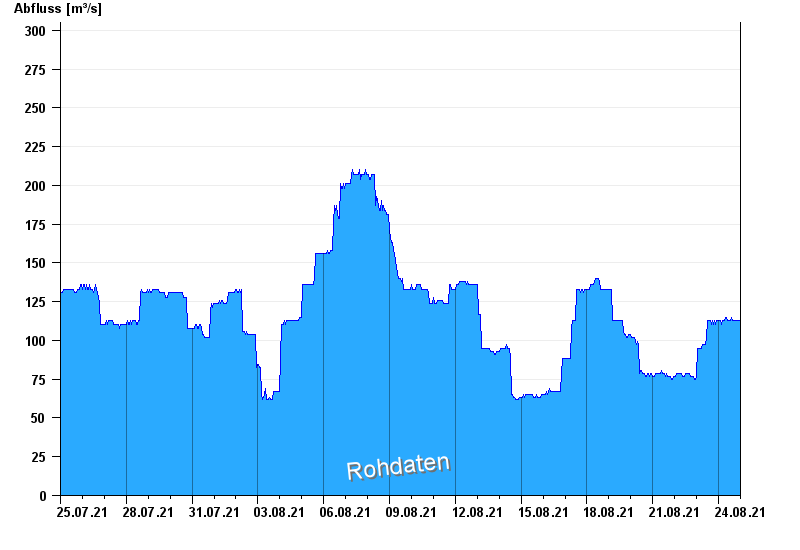
Chart of month Landsberg / Lech
Discharge from 25.07.2021 to 24.08.2021
note
Messwerte beeinflusst durch Kraftwerkssteuerungen.
- 10.08.1970 Abfluss: 1170 m³/s
- 22.05.1999 Abfluss: 1100 m³/s
- 23.08.2005 Abfluss: 987 m³/s
- 13.05.1999 Abfluss: 830 m³/s
- 24.07.1966 Abfluss: 712 m³/s
| Date | Runoff [m³/s] |
|---|---|
| 25.08.2021 00:45 | 113 |
| 25.08.2021 00:30 | 113 |
| 25.08.2021 00:15 | 110 |
| 25.08.2021 00:00 | 110 |
| 24.08.2021 23:45 | 113 |
| 24.08.2021 23:30 | 110 |
| 24.08.2021 23:15 | 110 |
© Bayerisches Landesamt für Umwelt 2024