
- Start >
- Rivers >
- Discharge >
- Iller - Lech - Bodensee >
- Landsberg >
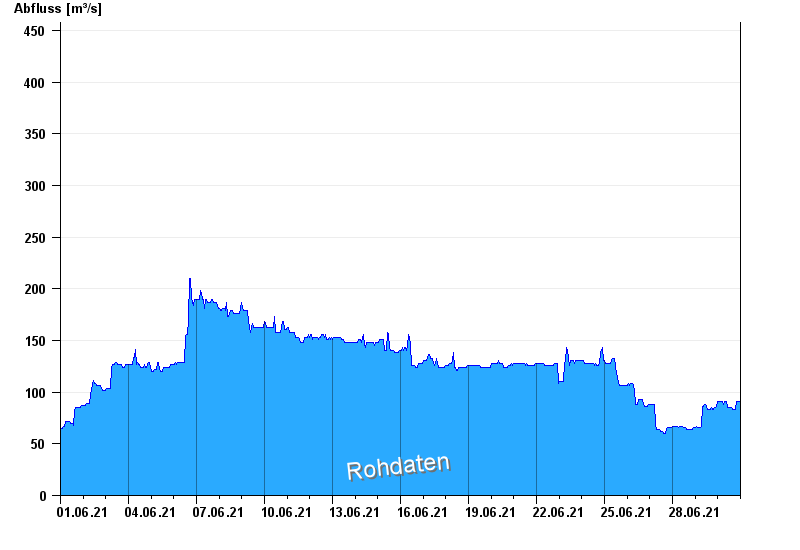
- Chart of month

Chart of month Landsberg / Lech
Discharge from 01.06.2021 to 30.06.2021
note
Messwerte beeinflusst durch Kraftwerkssteuerungen.
- HQ10 510 m³/s
- HQ100 1030 m³/s
| Date | Runoff [m³/s] |
|---|---|
| 01.07.2021 00:45 | 82.8 |
| 01.07.2021 00:30 | 82.8 |
| 01.07.2021 00:15 | 88.5 |
| 01.07.2021 00:00 | 91.1 |
| 30.06.2021 23:45 | 91.1 |
| 30.06.2021 23:30 | 88.5 |
| 30.06.2021 23:15 | 91.1 |
© Bayerisches Landesamt für Umwelt 2024