
- Start >
- Rivers >
- Discharge >
- Iller - Lech - Bodensee >
- Kempten >
- Chart of year

Chart of year Kempten / Iller
Discharge from 01.01.2024 to 18.04.2024
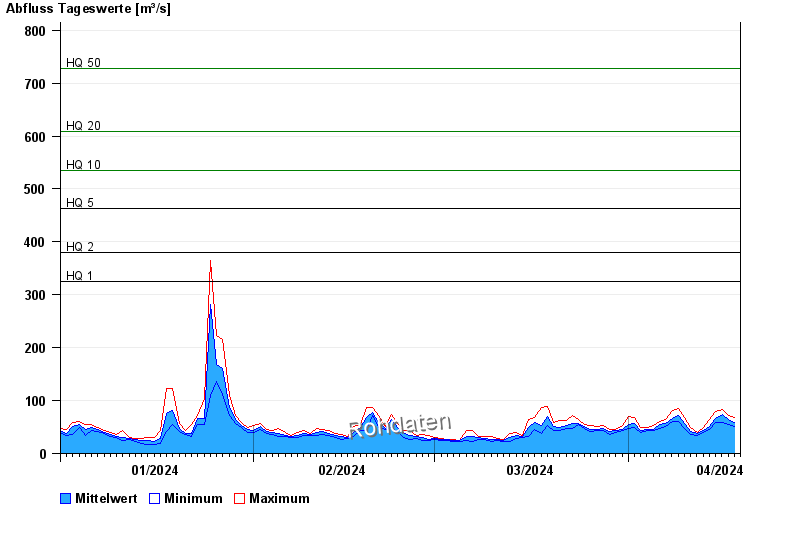
- HQ1 326 m³/s
- HQ2 379 m³/s
- HQ5 463 m³/s
- HQ10 534 m³/s
- HQ20 609 m³/s
- HQ50 728 m³/s
- HQ100 829 m³/s
| Date | Mean value [m³/s] | Maximum [m³/s] | Minimum [m³/s] |
|---|---|---|---|
| 18.04.2024 | 58.3 | 68.3 | 51.2 |
| 17.04.2024 | 63.5 | 72.5 | 54.8 |
| 16.04.2024 | 74 | 83.3 | 58.5 |
| 15.04.2024 | 66 | 80 | 58.5 |
| 14.04.2024 | 51.2 | 63.4 | 45.2 |
| 13.04.2024 | 43.4 | 49.5 | 38.8 |
| 12.04.2024 | 37.2 | 39.6 | 33.6 |
© Bayerisches Landesamt für Umwelt 2024