
- Start >
- Rivers >
- Discharge >
- Iller - Lech - Bodensee >
- Hörmanshofen >
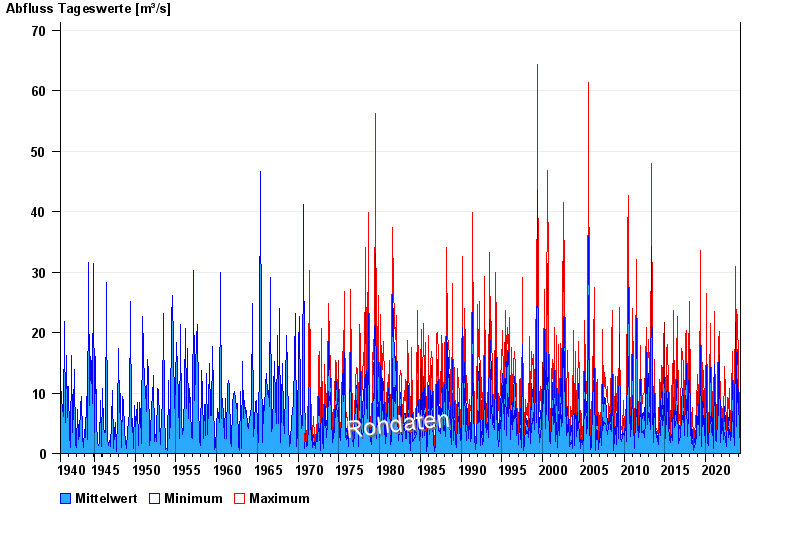
- Chart of total period

Chart of total period Hörmanshofen / Geltnach
Discharge from 01.11.1940 to 18.04.2024
| Date | Mean value [m³/s] | Maximum [m³/s] | Minimum [m³/s] |
|---|---|---|---|
| 18.04.2024 | 1.21 | 1.39 | 1.03 |
| 17.04.2024 | 0.655 | 1.27 | 0.427 |
| 16.04.2024 | 0.526 | 0.735 | 0.214 |
| 15.04.2024 | 0.438 | 0.827 | 0.214 |
| 14.04.2024 | 0.332 | 0.427 | 0.259 |
| 13.04.2024 | 0.345 | 0.427 | 0.214 |
| 12.04.2024 | 0.389 | 0.496 | 0.31 |
© Bayerisches Landesamt für Umwelt 2024