
- Start >
- Rivers >
- Discharge >
- Iller - Lech - Bodensee >
- Gschwend >
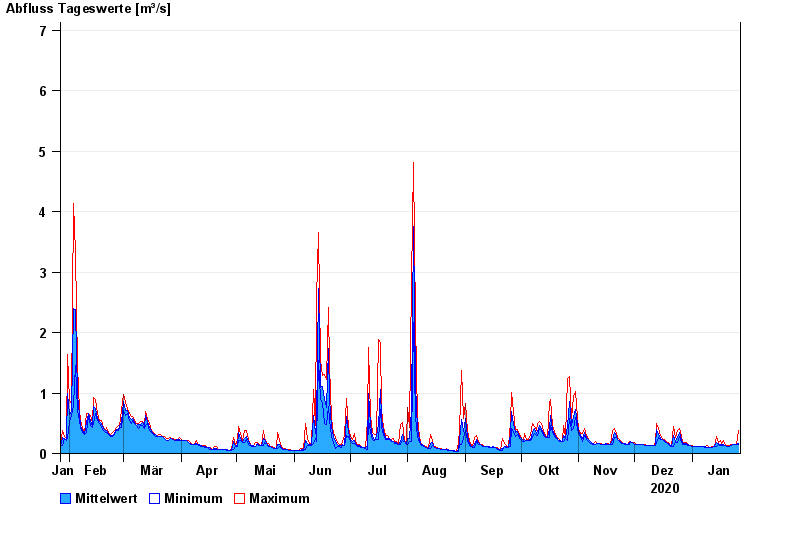
- Chart of year

Chart of year Gschwend / Rottach
Discharge from 27.01.2020 to 26.01.2021
- 23.08.2005 Abfluss: 16,2 m³/s
- 12.08.2002 Abfluss: 15 m³/s
- 02.06.2013 Abfluss: 13,4 m³/s
- 18.07.1997 Abfluss: 10,6 m³/s
- 21.09.2000 Abfluss: 10,4 m³/s
| Date | Mean value [m³/s] | Maximum [m³/s] | Minimum [m³/s] |
|---|---|---|---|
| 26.01.2021 | 0.159 | 0.381 | 0.154 |
| 25.01.2021 | 0.154 | 0.154 | 0.154 |
| 24.01.2021 | 0.154 | 0.154 | 0.154 |
| 23.01.2021 | 0.154 | 0.154 | 0.154 |
| 22.01.2021 | 0.14 | 0.154 | 0.131 |
| 21.01.2021 | 0.12 | 0.131 | 0.111 |
| 20.01.2021 | 0.12 | 0.131 | 0.111 |
© Bayerisches Landesamt für Umwelt 2024