
- Start >
- Rivers >
- Discharge >
- Iller - Lech - Bodensee >
- Gschwend >
- Chart of year

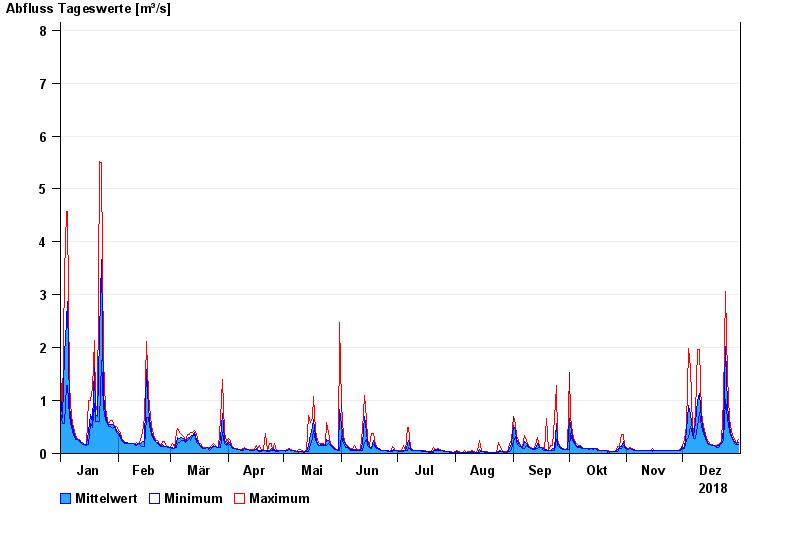
Chart of year Gschwend / Rottach
Discharge from 01.01.2018 to 31.12.2018
- 23.08.2005 Abfluss: 16,2 m³/s
- 12.08.2002 Abfluss: 15 m³/s
- 02.06.2013 Abfluss: 13,4 m³/s
- 18.07.1997 Abfluss: 10,6 m³/s
- 21.09.2000 Abfluss: 10,4 m³/s
| Date | Mean value [m³/s] | Maximum [m³/s] | Minimum [m³/s] |
|---|---|---|---|
| 31.12.2018 | 0.203 | 0.261 | 0.171 |
| 30.12.2018 | 0.193 | 0.198 | 0.171 |
| 29.12.2018 | 0.233 | 0.262 | 0.198 |
| 28.12.2018 | 0.247 | 0.297 | 0.23 |
| 27.12.2018 | 0.33 | 0.408 | 0.297 |
| 26.12.2018 | 0.517 | 0.653 | 0.408 |
| 25.12.2018 | 0.913 | 1.45 | 0.653 |
© Bayerisches Landesamt für Umwelt 2024