
- Start >
- Rivers >
- Discharge >
- Iller - Lech - Bodensee >
- Gschwend >
- Chart of total period

Chart of total period Gschwend / Rottach
Discharge from 01.11.1982 to 25.04.2024
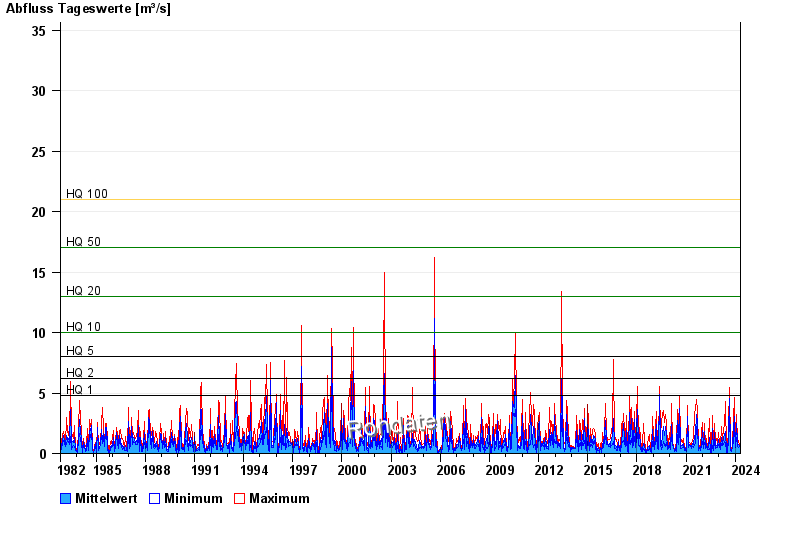
- HQ1 4,8 m³/s
- HQ2 6,2 m³/s
- HQ5 8 m³/s
- HQ10 10 m³/s
- HQ20 13 m³/s
- HQ50 17 m³/s
- HQ100 21 m³/s
| Date | Mean value [m³/s] | Maximum [m³/s] | Minimum [m³/s] |
|---|---|---|---|
| 25.04.2024 | 0.531 | 0.574 | 0.494 |
| 24.04.2024 | 0.464 | 0.614 | 0.344 |
| 23.04.2024 | 0.418 | 0.456 | 0.381 |
| 22.04.2024 | 0.491 | 0.574 | 0.456 |
| 21.04.2024 | 0.587 | 0.614 | 0.574 |
| 20.04.2024 | 0.695 | 0.827 | 0.614 |
| 19.04.2024 | 0.587 | 0.827 | 0.456 |
© Bayerisches Landesamt für Umwelt 2024