
- Start >
- Rivers >
- Discharge >
- Iller - Lech - Bodensee >
- Gruben >
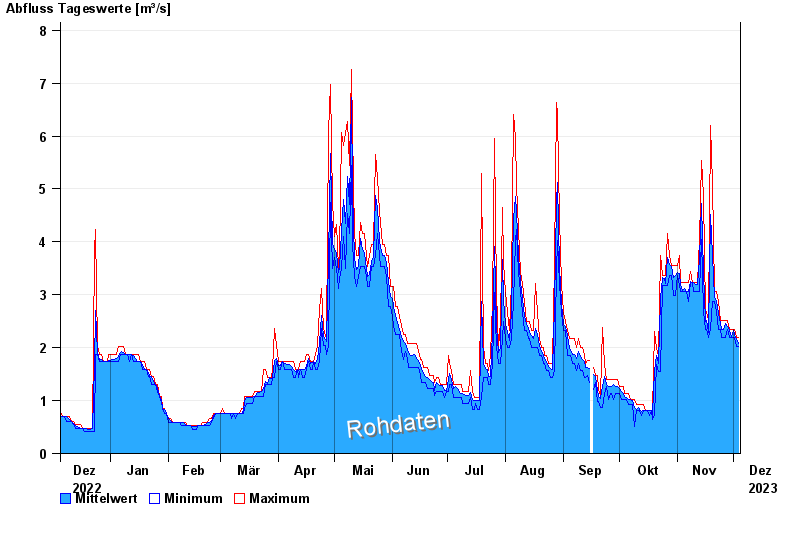
- Chart of year

Chart of year Gruben / Oybach
Discharge from 05.12.2022 to 04.12.2023
note
Beeinflussung durch Baumaßnahme
| Date | Mean value [m³/s] | Maximum [m³/s] | Minimum [m³/s] |
|---|---|---|---|
| 04.12.2023 | 2.07 | 2.19 | 2.03 |
| 03.12.2023 | 2.15 | 2.19 | 2.03 |
| 02.12.2023 | 2.24 | 2.35 | 2.19 |
| 01.12.2023 | 2.32 | 2.35 | 2.19 |
| 30.11.2023 | 2.22 | 2.35 | 2.19 |
| 29.11.2023 | 2.32 | 2.35 | 2.19 |
| 28.11.2023 | 2.4 | 2.52 | 2.35 |
© Bayerisches Landesamt für Umwelt 2024