
- Start >
- Rivers >
- Discharge >
- Iller - Lech - Bodensee >
- Gruben >
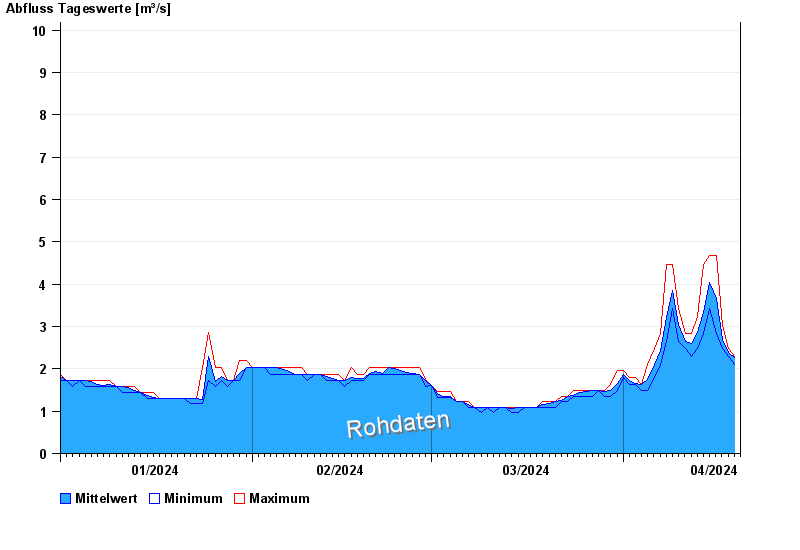
- Chart of year

Chart of year Gruben / Oybach
Discharge from 01.01.2024 to 19.04.2024
 Für diesen Pegel sind keine Jährlichkeiten hinterlegt.
note
Beeinflussung durch Baumaßnahme
| Date | Mean value [m³/s] | Maximum [m³/s] | Minimum [m³/s] |
|---|---|---|---|
| 19.04.2024 | 2.29 | 2.29 | 2.29 |
| 18.04.2024 | 2.38 | 2.47 | 2.29 |
| 17.04.2024 | 2.7 | 3.03 | 2.47 |
| 16.04.2024 | 3.65 | 4.68 | 2.84 |
| 15.04.2024 | 4.04 | 4.68 | 3.43 |
| 14.04.2024 | 3.32 | 4.46 | 2.84 |
| 13.04.2024 | 2.85 | 3.23 | 2.47 |
© Bayerisches Landesamt für Umwelt 2024