
- Start >
- Rivers >
- Discharge >
- Iller - Lech - Bodensee >
- Greifenmühle >
- Chart of year

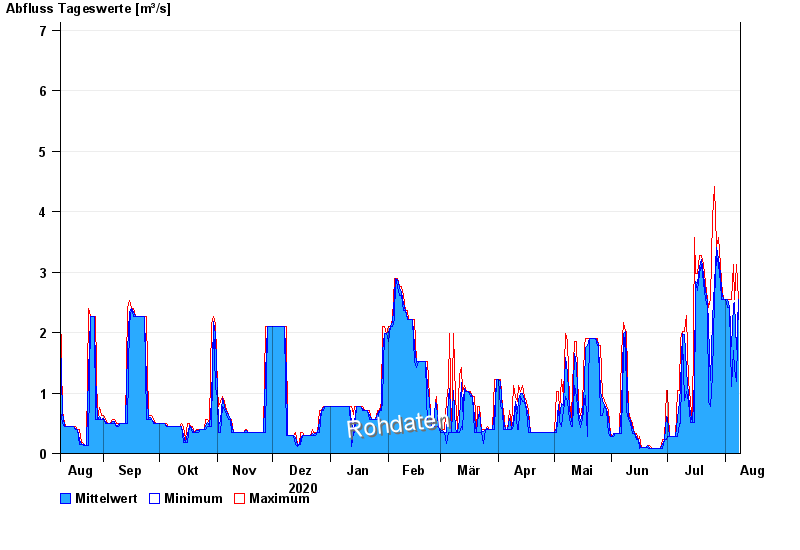
Chart of year Greifenmühle / Rottach
Discharge from 09.08.2020 to 08.08.2021
- 10.08.1970 Abfluss: 37,4 m³/s
- 10.08.1984 Abfluss: 37,1 m³/s
- 14.06.1983 Abfluss: 35,8 m³/s
- 08.08.1978 Abfluss: 33,8 m³/s
- 18.06.1970 Abfluss: 33,8 m³/s
| Date | Mean value [m³/s] | Maximum [m³/s] | Minimum [m³/s] |
|---|---|---|---|
| 08.08.2021 | 2.55 | 2.55 | 2.55 |
| 07.08.2021 | 1.72 | 3.12 | 1.19 |
| 06.08.2021 | 2.5 | 2.55 | 1.39 |
| 05.08.2021 | 2.47 | 3.12 | 1.7 |
| 04.08.2021 | 1.77 | 2.55 | 1.1 |
| 03.08.2021 | 2.43 | 2.55 | 2.42 |
| 02.08.2021 | 2.54 | 2.55 | 2.42 |
© Bayerisches Landesamt für Umwelt 2024