
- Start >
- Rivers >
- Discharge >
- Iller - Lech - Bodensee >
- Greifenmühle >
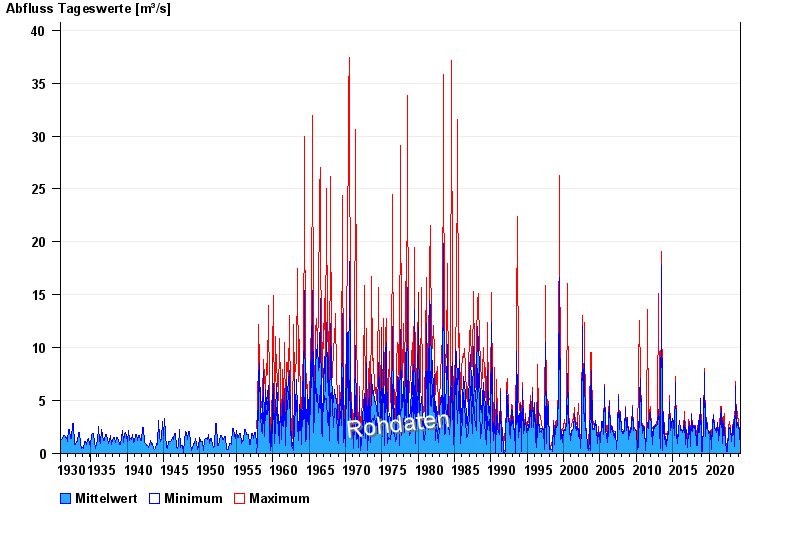
- Chart of total period

Chart of total period Greifenmühle / Rottach
Discharge from 01.11.1930 to 25.04.2024
| Date | Mean value [m³/s] | Maximum [m³/s] | Minimum [m³/s] |
|---|---|---|---|
| 25.04.2024 | 0.349 | 0.389 | 0.138 |
| 24.04.2024 | 0.357 | 0.389 | 0.339 |
| 23.04.2024 | 0.339 | 0.339 | 0.339 |
| 22.04.2024 | 0.339 | 0.339 | 0.339 |
| 21.04.2024 | 0.349 | 0.389 | 0.339 |
| 20.04.2024 | 0.389 | 0.389 | 0.389 |
| 19.04.2024 | 0.366 | 0.443 | 0.339 |
© Bayerisches Landesamt für Umwelt 2024