
- Start >
- Rivers >
- Discharge >
- Iller - Lech - Bodensee >
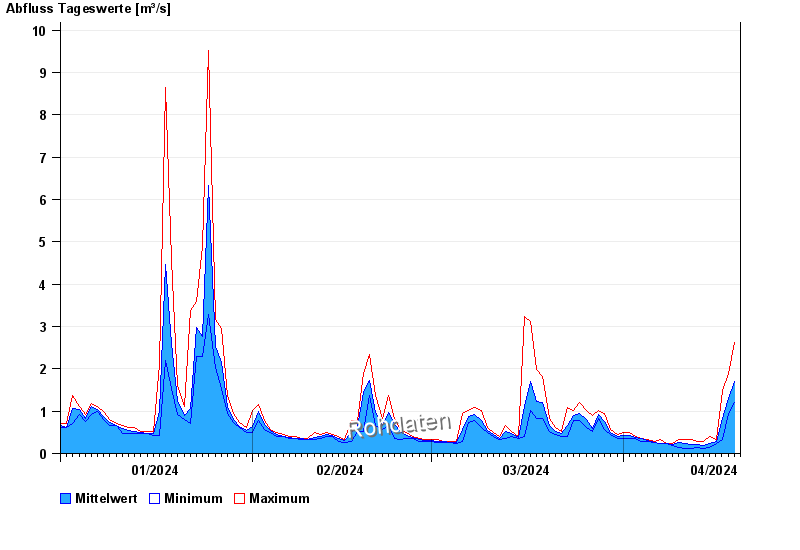
- Görisried >
- Chart of year

Chart of year Görisried / Waldbach
Discharge from 01.01.2024 to 19.04.2024
| Date | Mean value [m³/s] | Maximum [m³/s] | Minimum [m³/s] |
|---|---|---|---|
| 19.04.2024 | 1.54 | 1.66 | 1.43 |
| 18.04.2024 | 1.31 | 1.9 | 0.955 |
| 17.04.2024 | 0.825 | 1.5 | 0.327 |
| 16.04.2024 | 0.274 | 0.327 | 0.229 |
| 15.04.2024 | 0.23 | 0.402 | 0.151 |
| 14.04.2024 | 0.19 | 0.292 | 0.112 |
| 13.04.2024 | 0.202 | 0.292 | 0.151 |
© Bayerisches Landesamt für Umwelt 2024