
- Start >
- Rivers >
- Discharge >
- Iller - Lech - Bodensee >
- Fischach >
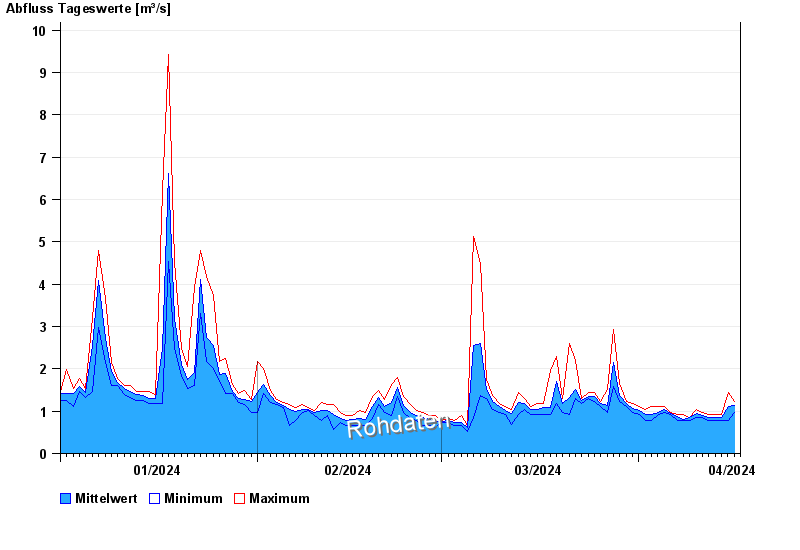
- Chart of year

Chart of year Fischach / Schmutter
Discharge from 01.01.2024 to 16.04.2024
| Date | Mean value [m³/s] | Maximum [m³/s] | Minimum [m³/s] |
|---|---|---|---|
| 16.04.2024 | 1.15 | 1.23 | 1.04 |
| 15.04.2024 | 1.11 | 1.44 | 0.79 |
| 14.04.2024 | 0.853 | 0.913 | 0.79 |
| 13.04.2024 | 0.854 | 0.913 | 0.79 |
| 12.04.2024 | 0.856 | 0.913 | 0.79 |
| 11.04.2024 | 0.903 | 0.971 | 0.851 |
| 10.04.2024 | 0.952 | 1.04 | 0.851 |
© Bayerisches Landesamt für Umwelt 2024