
- Start >
- Rivers >
- Discharge >
- Iller - Lech - Bodensee >
- Fischach >
- Chart of total period

Chart of total period Fischach / Schmutter
Discharge from 01.11.1950 to 25.04.2024
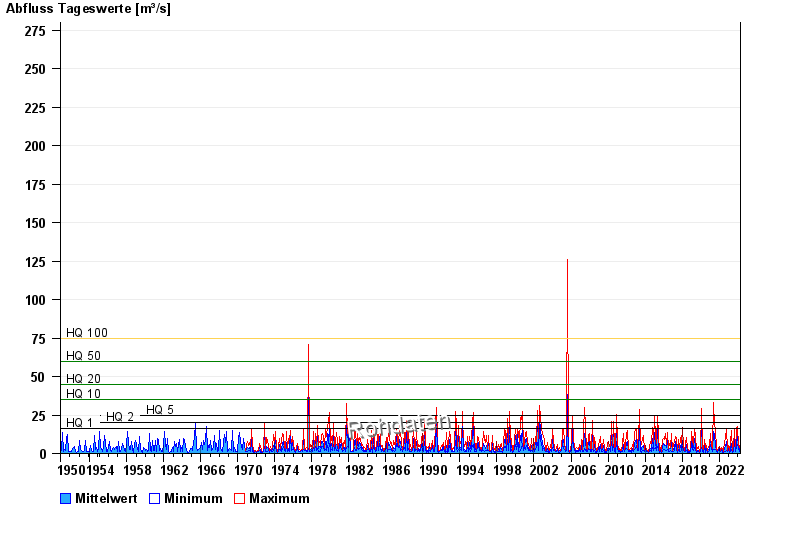
- HQ1 16 m³/s
- HQ2 20 m³/s
- HQ5 25 m³/s
- HQ10 35 m³/s
- HQ20 45 m³/s
- HQ50 60 m³/s
- HQ100 75 m³/s
| Date | Mean value [m³/s] | Maximum [m³/s] | Minimum [m³/s] |
|---|---|---|---|
| 25.04.2024 | 1.06 | 1.17 | 0.79 |
| 24.04.2024 | 1.17 | 1.23 | 1.1 |
| 23.04.2024 | 1.25 | 1.3 | 1.23 |
| 22.04.2024 | 1.42 | 1.59 | 1.3 |
| 21.04.2024 | 1.49 | 1.66 | 1.44 |
| 20.04.2024 | 1.83 | 1.96 | 1.59 |
| 19.04.2024 | 1.42 | 1.59 | 1.3 |
© Bayerisches Landesamt für Umwelt 2024