
- Start >
- Rivers >
- Discharge >
- Iller - Lech - Bodensee >
- Eschach >
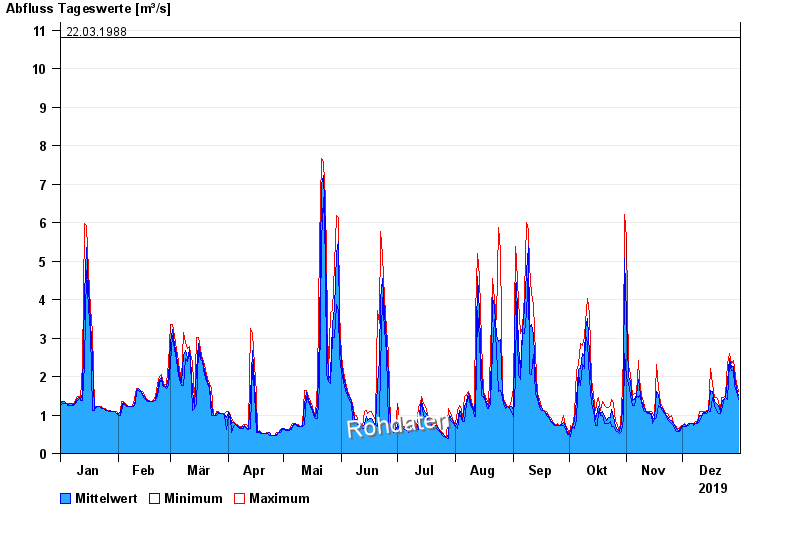
- Chart of year

Chart of year Eschach / Füssener Achen
Discharge from 01.01.2019 to 31.12.2019
note
Störung der Datenübertragung
- 23.08.2005 Abfluss: 14 m³/s
- 22.05.1999 Abfluss: 12,3 m³/s
- 18.06.1979 Abfluss: 11,8 m³/s
- 18.07.1997 Abfluss: 11,3 m³/s
- 22.03.1988 Abfluss: 10,8 m³/s
| Date | Mean value [m³/s] | Maximum [m³/s] | Minimum [m³/s] |
|---|---|---|---|
| 31.12.2019 | 1.51 | 1.61 | 1.4 |
| 30.12.2019 | 1.69 | 1.83 | 1.61 |
| 29.12.2019 | 2 | 2.2 | 1.77 |
| 28.12.2019 | 2.27 | 2.41 | 2.15 |
| 27.12.2019 | 2.23 | 2.35 | 2.15 |
| 26.12.2019 | 2.46 | 2.61 | 2.35 |
| 25.12.2019 | 1.86 | 2.35 | 1.4 |
© Bayerisches Landesamt für Umwelt 2024