
- Start >
- Rivers >
- Discharge >
- Iller - Lech - Bodensee >
- Eschach >
- Chart of total period

Chart of total period Eschach / Füssener Achen
Discharge from 01.11.1954 to 24.04.2024
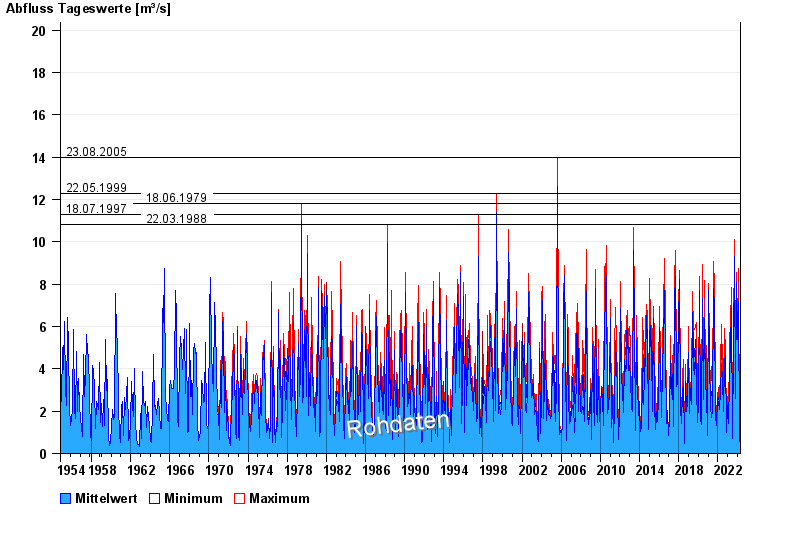
- 23.08.2005 Abfluss: 14 m³/s
- 22.05.1999 Abfluss: 12,3 m³/s
- 18.06.1979 Abfluss: 11,8 m³/s
- 18.07.1997 Abfluss: 11,3 m³/s
- 22.03.1988 Abfluss: 10,8 m³/s
| Date | Mean value [m³/s] | Maximum [m³/s] | Minimum [m³/s] |
|---|---|---|---|
| 24.04.2024 | 1.31 | 1.39 | 1.28 |
| 23.04.2024 | 2.09 | 3.54 | 1.23 |
| 22.04.2024 | 2.75 | 3.81 | 1.55 |
| 21.04.2024 | 1.48 | 1.61 | 1.34 |
| 20.04.2024 | 1.23 | 1.34 | 1.08 |
| 19.04.2024 | 0.976 | 1.13 | 0.786 |
| 18.04.2024 | 0.815 | 0.879 | 0.744 |
© Bayerisches Landesamt für Umwelt 2024