
- Start >
- Rivers >
- Discharge >
- Iller - Lech - Bodensee >
- Durach >
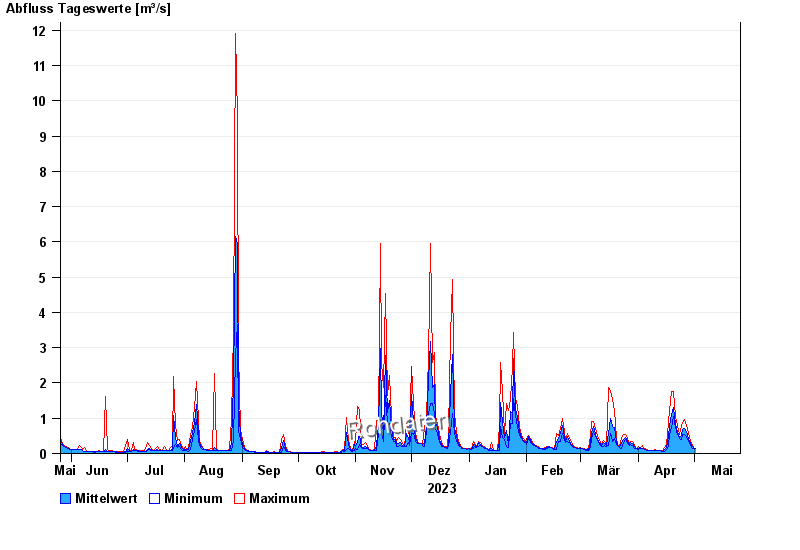
- Chart of year

Chart of year Durach / Durach
Discharge from 26.05.2023 to 25.05.2024
| Date | Mean value [m³/s] | Maximum [m³/s] | Minimum [m³/s] |
|---|---|---|---|
| 19.04.2024 | 1.05 | 1.05 | 1.05 |
| 18.04.2024 | 0.782 | 1.23 | 0.536 |
| 17.04.2024 | 0.486 | 0.876 | 0.194 |
| 16.04.2024 | 0.166 | 0.246 | 0.113 |
| 15.04.2024 | 0.1 | 0.171 | 0.059 |
| 14.04.2024 | 0.071 | 0.071 | 0.059 |
| 13.04.2024 | 0.071 | 0.071 | 0.071 |
© Bayerisches Landesamt für Umwelt 2024