
- Start >
- Rivers >
- Discharge >
- Iller - Lech - Bodensee >
- Durach >
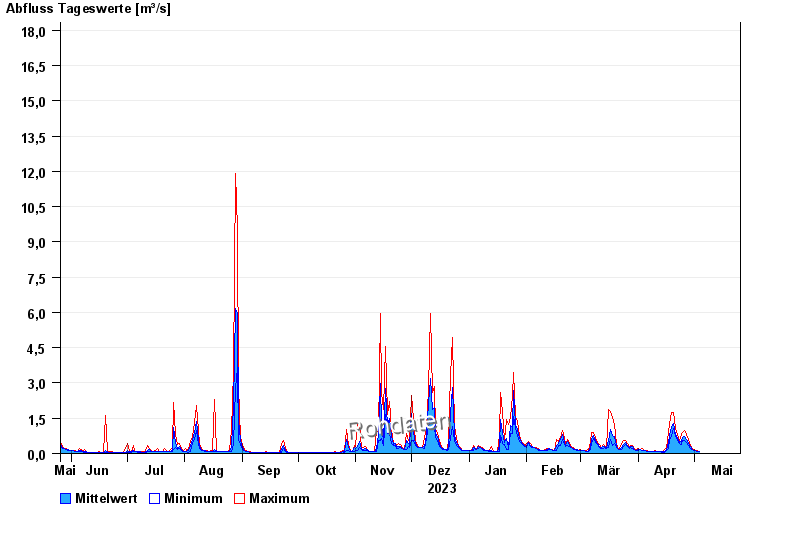
- Chart of year

Chart of year Durach / Durach
Discharge from 26.05.2023 to 25.05.2024
- 22.07.1972 Abfluss: 49 m³/s
- 10.08.1970 Abfluss: 40 m³/s
- 08.08.1978 Abfluss: 30,5 m³/s
- 16.07.2002 Abfluss: 29,1 m³/s
- 02.06.2013 Abfluss: 27,1 m³/s
| Date | Mean value [m³/s] | Maximum [m³/s] | Minimum [m³/s] |
|---|---|---|---|
| 25.04.2024 | 0.691 | 0.725 | 0.657 |
| 24.04.2024 | 0.497 | 0.799 | 0.389 |
| 23.04.2024 | 0.455 | 0.536 | 0.433 |
| 22.04.2024 | 0.623 | 0.799 | 0.536 |
| 21.04.2024 | 0.81 | 1.05 | 0.725 |
| 20.04.2024 | 1.29 | 1.75 | 1.05 |
| 19.04.2024 | 1.11 | 1.75 | 0.725 |
© Bayerisches Landesamt für Umwelt 2024