
- Start >
- Rivers >
- Discharge >
- Iller - Lech - Bodensee >
- Durach >
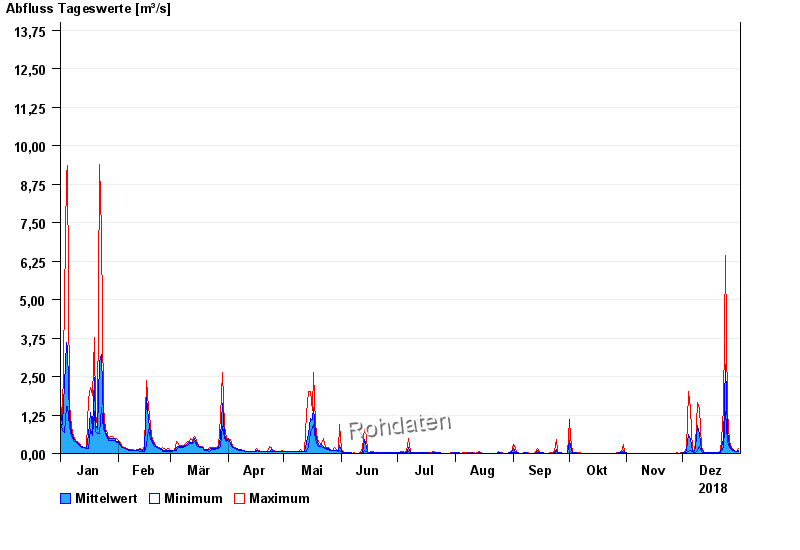
- Chart of year

Chart of year Durach / Durach
Discharge from 01.01.2018 to 31.12.2018
- 22.07.1972 Abfluss: 49 m³/s
- 10.08.1970 Abfluss: 40 m³/s
- 08.08.1978 Abfluss: 30,5 m³/s
- 16.07.2002 Abfluss: 29,1 m³/s
- 02.06.2013 Abfluss: 27,1 m³/s
| Date | Mean value [m³/s] | Maximum [m³/s] | Minimum [m³/s] |
|---|---|---|---|
| 31.12.2018 | 0.109 | 0.171 | 0.068 |
| 30.12.2018 | 0.077 | 0.079 | 0.068 |
| 29.12.2018 | 0.088 | 0.104 | 0.079 |
| 28.12.2018 | 0.116 | 0.134 | 0.104 |
| 27.12.2018 | 0.159 | 0.194 | 0.134 |
| 26.12.2018 | 0.273 | 0.403 | 0.194 |
| 25.12.2018 | 0.717 | 1.35 | 0.403 |
© Bayerisches Landesamt für Umwelt 2024