
- Start >
- Rivers >
- Discharge >
- Iller - Lech - Bodensee >
- Durach >
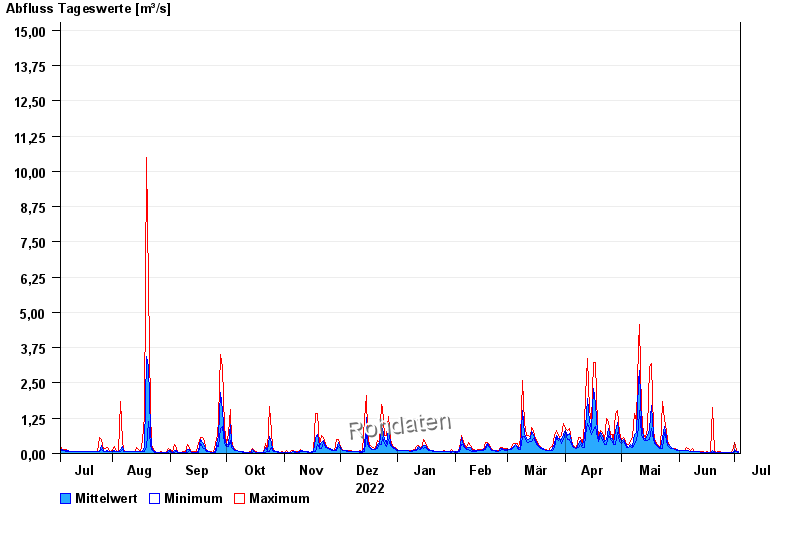
- Chart of year

Chart of year Durach / Durach
Discharge from 04.07.2022 to 03.07.2023
- 22.07.1972 Abfluss: 49 m³/s
- 10.08.1970 Abfluss: 40 m³/s
- 08.08.1978 Abfluss: 30,5 m³/s
- 16.07.2002 Abfluss: 29,1 m³/s
- 02.06.2013 Abfluss: 27,1 m³/s
| Date | Mean value [m³/s] | Maximum [m³/s] | Minimum [m³/s] |
|---|---|---|---|
| 03.07.2023 | 0.067 | 0.072 | 0.047 |
| 02.07.2023 | 0.072 | 0.122 | 0.059 |
| 01.07.2023 | 0.13 | 0.406 | 0.059 |
| 30.06.2023 | 0.05 | 0.221 | 0.037 |
| 29.06.2023 | 0.037 | 0.047 | 0.029 |
| 28.06.2023 | 0.037 | 0.047 | 0.029 |
| 27.06.2023 | 0.04 | 0.047 | 0.037 |
© Bayerisches Landesamt für Umwelt 2024