
- Start >
- Rivers >
- Discharge >
- Iller - Lech - Bodensee >
- Brunnen >
- Chart of year

Chart of year Brunnen / Mühlberger Ach
Discharge from 28.09.2021 to 27.09.2022
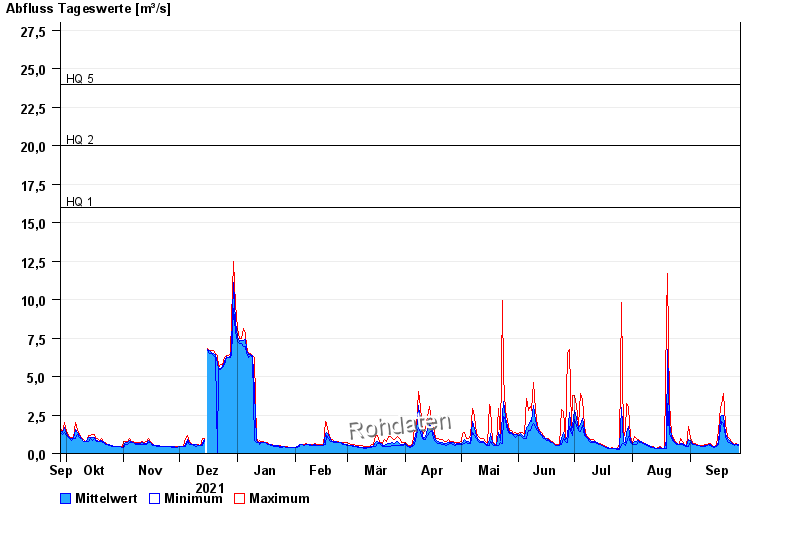
- HQ1 16 m³/s
- HQ2 20 m³/s
- HQ5 24 m³/s
- HQ10 30 m³/s
- HQ20 36 m³/s
- HQ50 44 m³/s
- HQ100 50 m³/s
| Date | Mean value [m³/s] | Maximum [m³/s] | Minimum [m³/s] |
|---|---|---|---|
| 27.09.2022 | 0.553 | 0.572 | 0.508 |
| 26.09.2022 | 0.612 | 0.644 | 0.572 |
| 25.09.2022 | 0.553 | 0.572 | 0.508 |
| 24.09.2022 | 0.598 | 0.644 | 0.572 |
| 23.09.2022 | 0.688 | 0.801 | 0.644 |
| 22.09.2022 | 0.825 | 0.984 | 0.72 |
| 21.09.2022 | 0.97 | 1.09 | 0.801 |
© Bayerisches Landesamt für Umwelt 2024