
- Start >
- Rivers >
- Discharge >
- Iller - Lech - Bodensee >
- Aeschach >
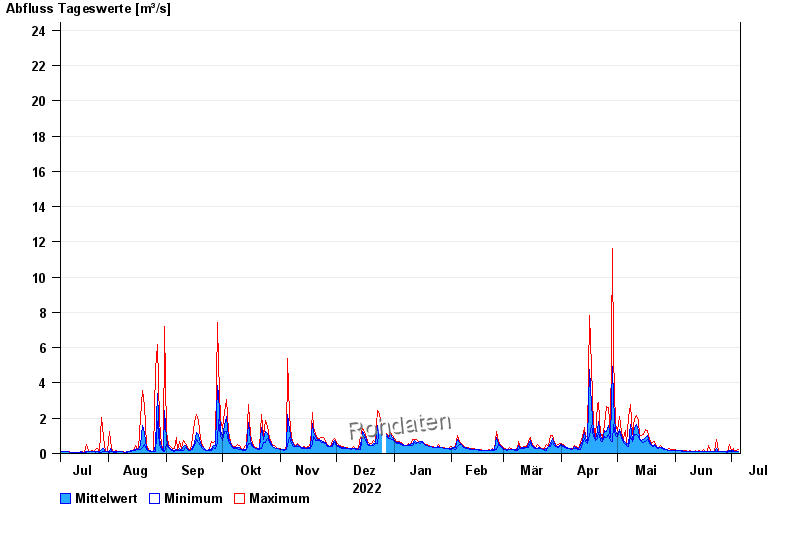
- Chart of year

Chart of year Aeschach / Oberreitnauer Ach
Discharge from 06.07.2022 to 05.07.2023
 Für diesen Pegel sind keine Jährlichkeiten hinterlegt.
| Date | Mean value [m³/s] | Maximum [m³/s] | Minimum [m³/s] |
|---|---|---|---|
| 05.07.2023 | 0.124 | 0.239 | 0.103 |
| 04.07.2023 | 0.118 | 0.147 | 0.094 |
| 03.07.2023 | 0.11 | 0.124 | 0.103 |
| 02.07.2023 | 0.176 | 0.258 | 0.124 |
| 01.07.2023 | 0.144 | 0.189 | 0.124 |
| 30.06.2023 | 0.145 | 0.514 | 0.094 |
| 29.06.2023 | 0.092 | 0.124 | 0.085 |
© Bayerisches Landesamt für Umwelt 2024